 English

 Русский
 Bahasa Indonesia
 Bahasa Malay
 ไทย
 Español
 Deutsch
 Български
 Français
 Tiếng Việt
 中文
 বাংলা
 हिन्दी
 Čeština
 Українська
 Română



Analysis GBP/USD 5M
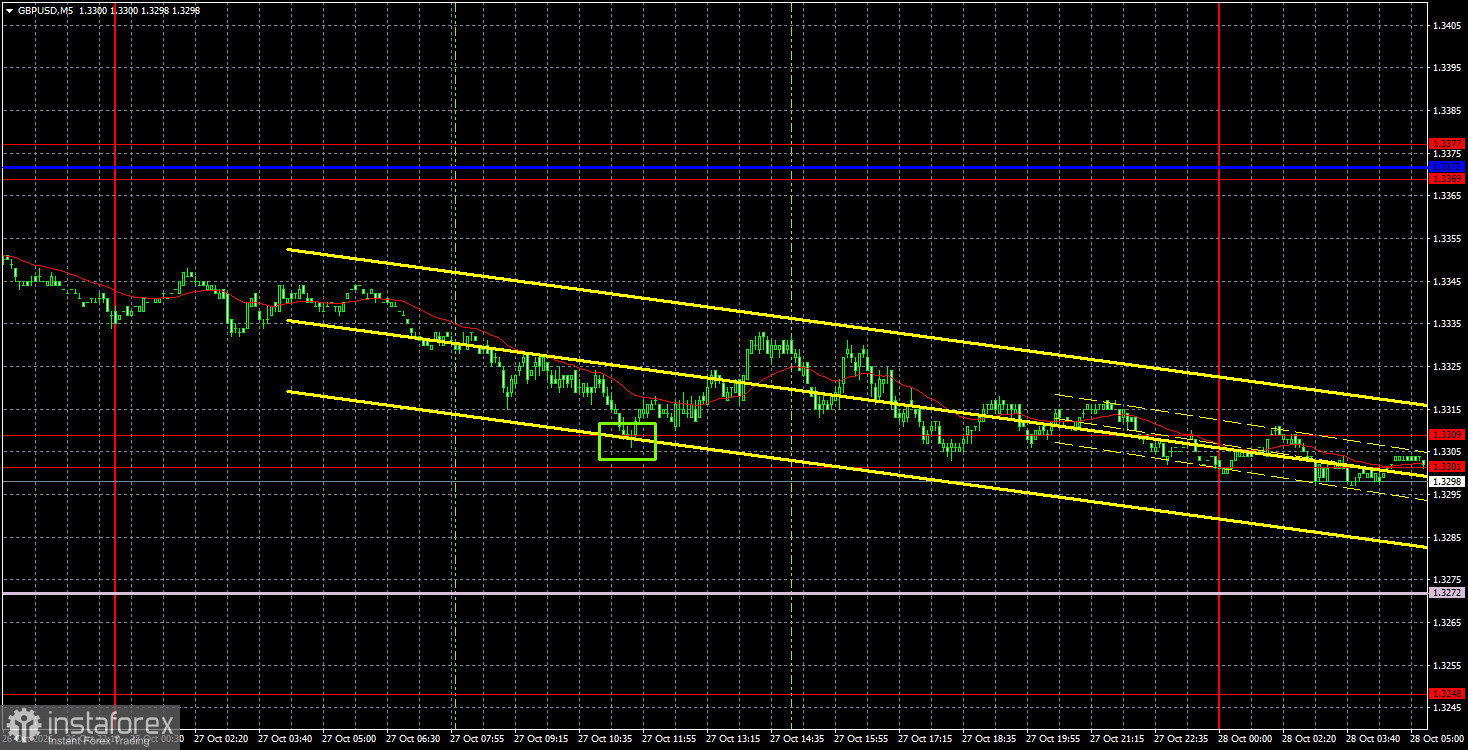
The GBP/USD pair continued to fall on Tuesday, despite no strong fundamental reasons for renewed dollar strength. The only event on Tuesday that could have boosted the dollar was the U.S. durable-goods report, which showed a 1.8% rise in September, slightly above the 1.5% forecast. However, the dollar strengthened throughout the day, not just after the release. In sterling's case, the recent decline appears to be a technical correction after a larger up move. We still expect the pound to strengthen at least toward 1.3650. We believe the fundamental backdrop this week and next should support the pound. Yet today the Federal Reserve will deliver a neutral decision, and the Bank of England is set to raise rates next week—yet the dollar has been rising. Thus sterling has traded more consistently and logically than the euro in recent weeks, but it still falls more often than it rises. As long as the sideways channels on the daily and weekly timeframes remain in place, we expect GBP/USD to move higher.
Technically, sterling continues to form a new uptrend. A correction is possible, but the pair must not drop below the Senkou Span B line—if it does, the uptrend can be considered invalidated. A trendline is not yet present because two clear extremes required to draw it are missing.
On the 5-minute timeframe, one buy signal formed on Tuesday. During the European session, price bounced from the 1.3301–1.3309 area but managed only a 16-pip rise. By the end of the day, longs could have been closed at breakeven.
COT report
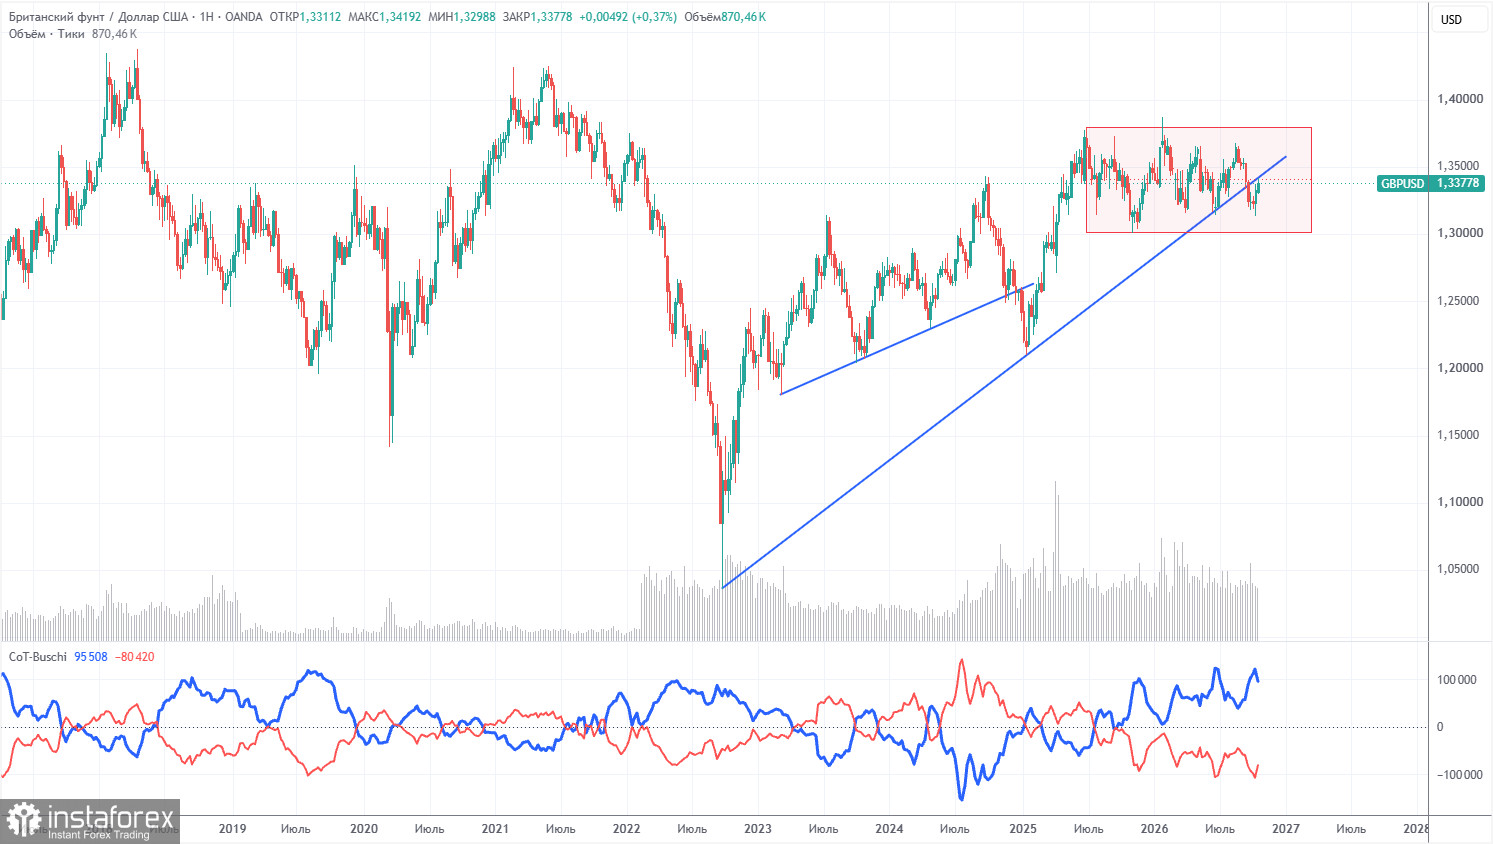
COT reports for the pound show that non-commercial traders have dominated selling for several months. The net position is negative despite the long-term uptrend persisting. Given events in the Middle East, it is unsurprising that dollar demand remains high in 2026. The U.S.–Iran war is formally on pause but could resume soon. The Fed's changed monetary stance also supports the dollar, and the ascending trend line was breached; however, it was broken amid a flat, so we do not consider the uptrend complete.
In the long term, the dollar continues to weaken due to Donald Trump's policies, which is clearly visible on the weekly TF. Trade tensions will persist in one form or another for a long time, and Trump's policies aim, directly and indirectly, to weaken the U.S. currency. The long-term uptrend remains intact. According to the latest COT report (dated October 20), the "Non-commercial" group opened 10,000 BUY contracts and closed 16,500 SELL contracts. Thus, the net position of non-commercial traders increased by 26,500 contracts over the week.
Analysis EUR/USD 1H
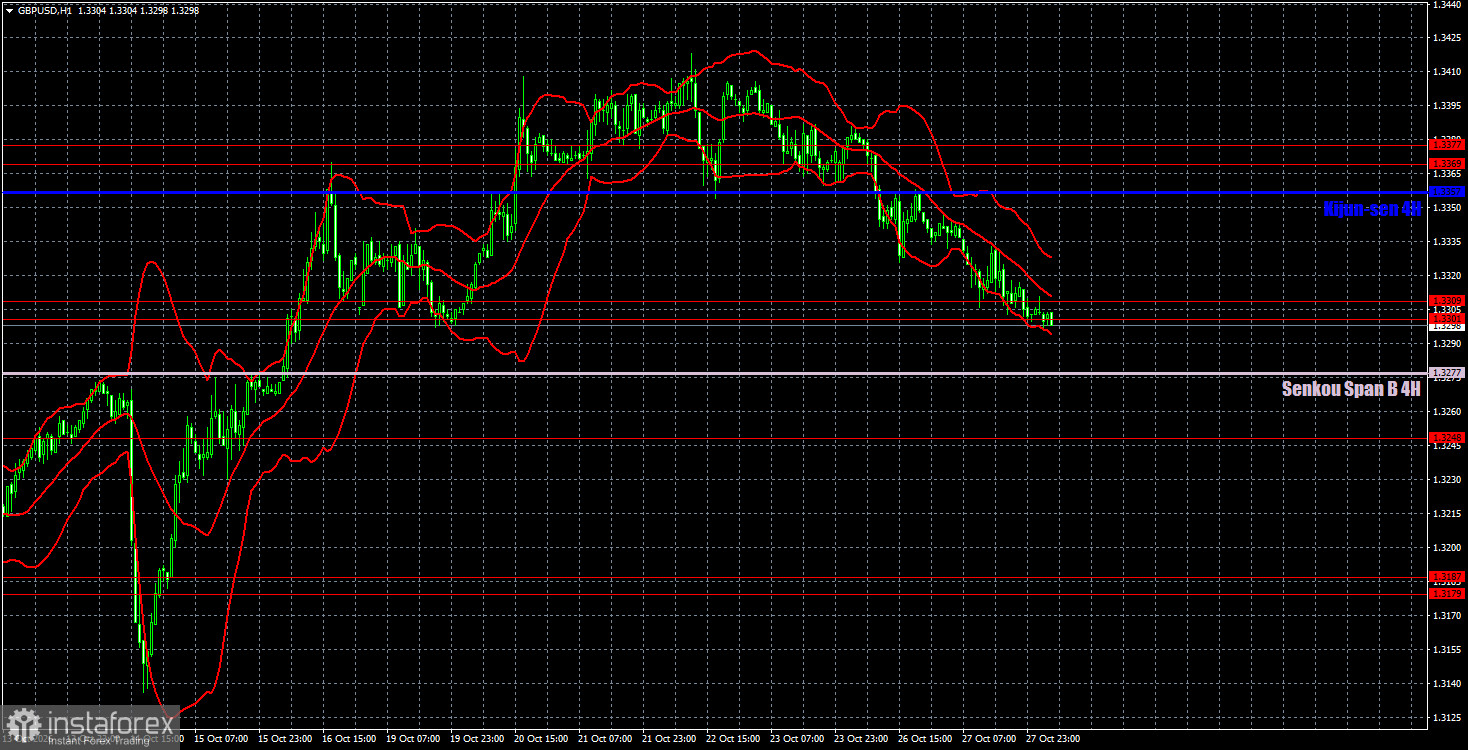
On the hourly timeframe, the GBP/USD pair continues to form a logical, orderly uptrend, along with corrections against it. On the daily and weekly timeframes, the price cleared liquidity from recent lows and remained inside sideways channels. Therefore, one can expect the pound to rise at least to the 1.3650 level, the upper boundary of the sideways channel on the daily chart. We don't need reasons for the pound's rise, just as we didn't need reasons for the dollar's rise over the past month and a half.
For October 28 we highlight the following important levels: 1.3042–1.3050, 1.3096–1.3115, 1.3179–1.3187, 1.3248, 1.3301–1.3309, 1.3369–1.3377, 1.3465–1.3480, 1.3588, 1.3671–1.3681. The Senkou Span B line (1.3277) and the Kijun-sen (1.3357) can also provide signals. It is recommended to move the Stop Loss to breakeven after the price moves 20 pips in the right direction. Ichimoku lines may shift during the day, so traders should account for this when determining trading signals.
No important events or releases are scheduled in the UK today; in the U.S., the Fed meeting and Kevin Warsh's remarks will take place. Therefore, the main market moves are expected in the evening and overnight.
Summary of the above analysis:
Traders can consider 1.3277 and 1.3248 as targets for short positions if price holds below the 1.3301–1.3309 area. A rebound from the 1.3301–1.3309 area makes 1.3369–1.3377 targets for long positions.
Explanations for the illustrations:
- Price support and resistance levels (resistance/support) — thick red lines around which movement may end. They are not sources of trading signals.
- Kijun-sen and Senkou Span B lines — Ichimoku indicator lines transferred to the hourly timeframe from the 4-hour timeframe. They are strong lines.
- Extreme levels — thin red lines from which the price previously bounced. They are sources of trading signals.
- Yellow lines — trendlines, trend channels, and any other technical patterns.
- Indicator 1 on the COT charts — the size of the net position of each trader category.