 English

 Русский
 Bahasa Indonesia
 Bahasa Malay
 ไทย
 Español
 Deutsch
 Български
 Français
 Tiếng Việt
 中文
 বাংলা
 हिन्दी
 Čeština
 Українська
 Română



Trade Review and Trading Tips for the Japanese Yen
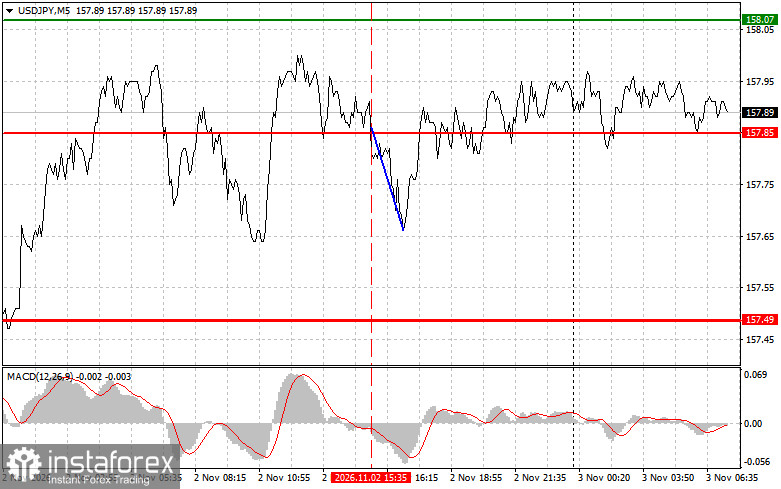
The test of 157.85 occurred when the MACD indicator had just begun moving downward from the zero line, prompting traders to sell the dollar against the yen. As a result, the pair declined by 20 points.
The yen received moderate support from domestic economic data yesterday, but this proved insufficient. Japan's manufacturing PMI for October came in at 53.3, in line with both the forecast and the previous reading. The index is well above 50, indicating that activity in the sector continues to expand. However, the absence of a positive surprise failed to provide the yen with independent momentum. US economic data was the main driver of USD/JPY. The US manufacturing ISM index came in at 55.5, compared with a forecast of 54.5. This strong reading strengthened expectations regarding the Fed's interest rate, which typically leads to higher US Treasury yields. This is a negative signal for the yen, as the yield differential between US and Japanese government bonds widens. Furthermore, the ISM price index declined only to 75.2, preventing the dollar from weakening. Today, the focus is on the US midterm elections. According to analysts, the Democrats could gain 12 to 25 seats in the House of Representatives, while the outlook in the Senate remains more uncertain. Uncertainty surrounding the election results could trigger sharp movements in Treasury yields and the dollar, leaving the yen caught between two opposing forces. On the one hand, increased risk aversion typically supports the yen as a safe-haven asset. On the other hand, yesterday's strong US economic data continues to support demand for the dollar and put pressure on the pair. USD/JPY is likely to be driven by movements in US Treasury yields and market sentiment surrounding the elections through the end of the day.
Regarding the intraday strategy, the focus will primarily be on implementing Scenarios No. 1 and No. 2.
Buying Scenarios
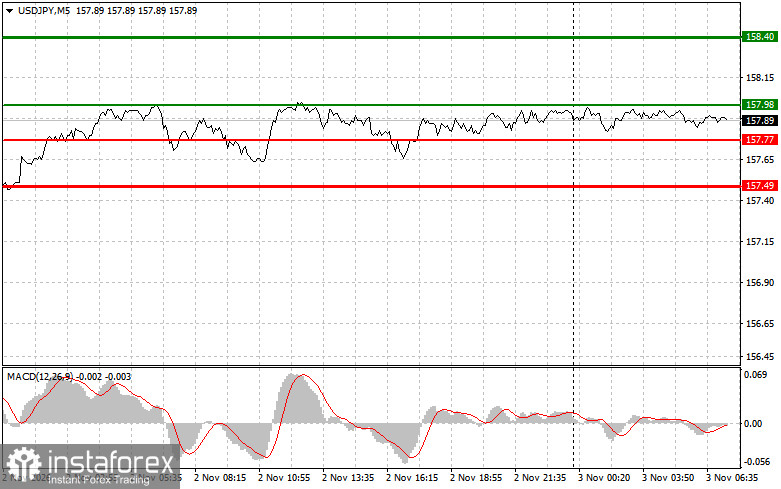
Scenario No. 1: USD/JPY will be bought today if the price reaches the entry level around 157.98 (the green line on the chart), with a target of 158.40 (the thicker green line on the chart). Around 158.40, the long position will be closed and a short position will be opened, targeting a move of 30–35 points in the opposite direction from that level. It is preferable to resume buying the pair during corrections and significant pullbacks in USD/JPY. Important: Before buying, make sure that the MACD indicator is above the zero line and has just begun moving upward from it.
Scenario No. 2: USD/JPY will also be bought today if the price tests 157.77 twice consecutively while the MACD indicator is in the oversold zone. This would limit the pair's downward potential and trigger a reversal to the upside. The pair could then rise toward the opposite levels of 157.98 and 158.40.
Selling Scenarios
Scenario No. 1: USD/JPY will be sold today only after the price breaks below 157.77 (the red line on the chart), which could trigger a rapid decline in the pair. The sellers' main target will be 157.49, where the short position will be closed and a long position will be opened immediately, targeting a rebound of 20–25 points in the opposite direction from that level. Sellers could return at any time, as even the slightest signal from the central bank could be enough to trigger renewed selling pressure. Important: Before selling, make sure that the MACD indicator is below the zero line and has just begun moving downward from it.
Scenario No. 2: USD/JPY will also be sold today if the price tests 157.98 twice consecutively while the MACD indicator is in the overbought zone. This would limit the pair's upward potential and trigger a reversal to the downside. The pair could then decline toward the next levels of 157.77 and 157.49.
What the Chart Shows:
- Thin green line – the entry price at which the trading instrument can be bought.
- Thick green line – the estimated price level at which Take Profit can be set or profits can be taken manually, as further gains above this level are unlikely.
- Thin red line – the entry price at which the trading instrument can be sold.
- Thick red line – the estimated price level at which Take Profit can be set or profits can be taken manually, as further declines below this level are unlikely.
- MACD indicator. When entering the market, it is important to consider the overbought and oversold zones.
Important. Beginner Forex traders should exercise considerable caution when deciding when to enter the market. Before the release of major fundamental reports, it is best to stay out of the market to avoid sudden exchange rate fluctuations. If trading during news releases, always place stop-loss orders to minimize losses. Without stop-loss orders, the entire trading account can be lost very quickly, especially when trading large volumes without proper money management.
Remember that successful trading requires a clear trading plan, such as the one outlined above. Making spontaneous trading decisions based on current market conditions is a losing strategy for intraday traders from the outset.