 English

 Русский
 Bahasa Indonesia
 Bahasa Malay
 ไทย
 Español
 Deutsch
 Български
 Français
 Tiếng Việt
 中文
 বাংলা
 हिन्दी
 Čeština
 Українська
 Română



EUR/USD
Analysis:
In the short term, the dominant wave structure on the major euro pair chart has been bearish since August 20. A corrective movement has been developing within this structure since early October. It takes the form of an expanded flat. At the time of analysis, the structure appears to be complete, with the final wave (C) forming. The price is currently within a cluster of potential reversal zones of different scales.
Forecast:
Over the coming week, the euro is expected to trade predominantly sideways. A short-term rise and brief pressure on the resistance zone are possible over the next couple of days. Subsequently, the downward movement is likely to resume, potentially reaching the support levels. Increased volatility is expected in the second half of the week.
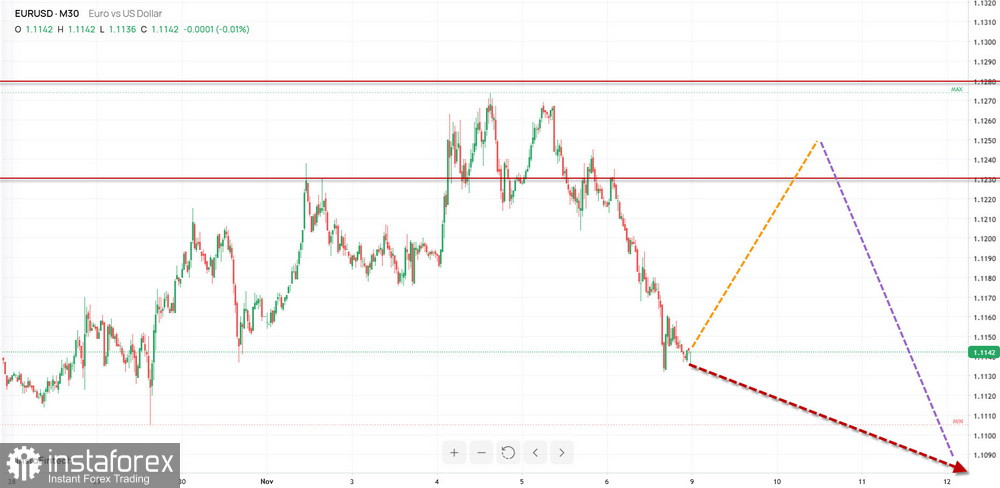
Potential Reversal Zones
Resistance:
- 1.1230/1.1280
Support:
- 1.1010/1.0960
Trading Recommendations:
Selling: Short positions may become the primary trading strategy once confirmed signals emerge near the resistance zone.
Buying: Long positions may be considered with reduced position sizes during individual intraday trading sessions.
USD/JPY
Analysis:
The short-term chart has shown a weakening of the Japanese yen against the US dollar since early September of this year. By October, the major yen pair had reached the lower boundary of a strong potential reversal zone on the weekly timeframe. The unfinished section of the wave structure is corrective in nature and takes the form of an expanded flat.
Forecast:
At the beginning of the week, further price growth is the most likely scenario, followed by sideways consolidation along the resistance zone. Subsequently, a reversal may form in this section of the chart, marking the beginning of a downward movement. The projected support level limits the potential extent of the weekly decline.
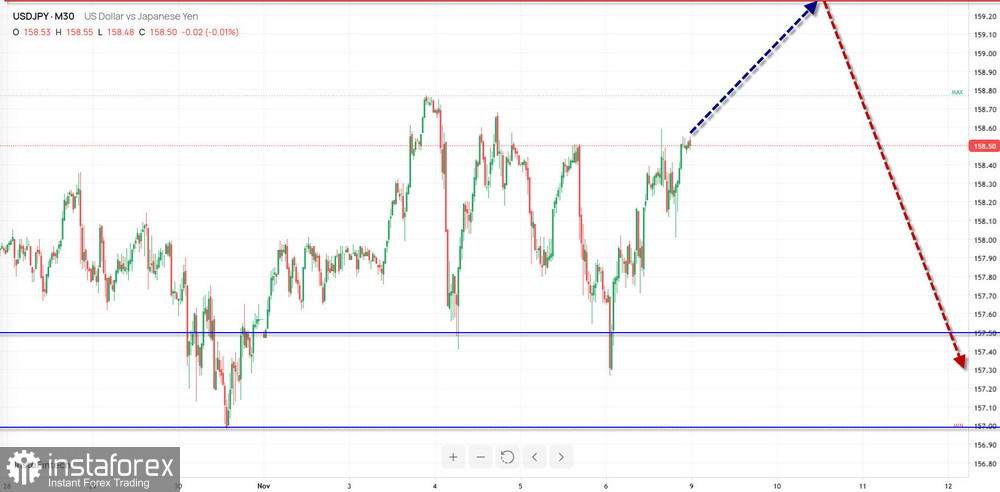
Potential Reversal Zones
Resistance:
- 159.30/159.80
Support:
- 157.50/157.00
Trading Recommendations:
Buying: Long positions may be considered once the relevant signals appear in the trading systems being used.
Selling: Opening short positions before confirmed reversal signals emerge in the upper reversal zone would be premature.
GBP/JPY
Analysis:
The short-term chart of the British pound/Japanese yen pair shows that an upward trend-setting wave has dominated over the past two months. The currently unfinished wave section is bearish and began on November 4. The structure of this wave section does not yet show signs of completion.
Forecast:
During the first few days of the coming week, price movement is likely to remain predominantly sideways, with an upward bias. The upward movement has the potential to reach the upper boundary of the resistance zone. A reversal and the beginning of a downward movement in the pair are expected in the second half of the week. The decline may continue as far as the support levels.
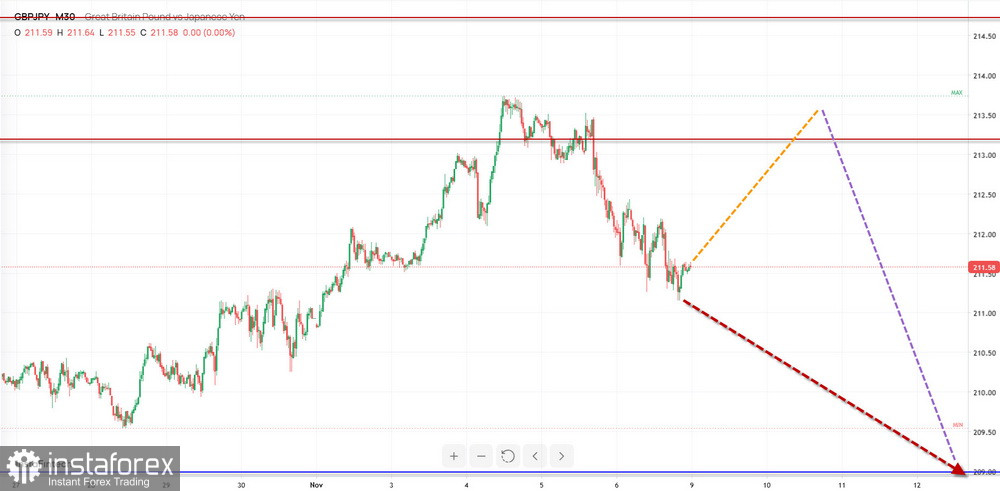
Potential Reversal Zones
Resistance:
- 213.20/213.70
Support:
- 209.20/208.70
Trading Recommendations:
Buying: Upward potential is limited by resistance. Reducing position sizes is advisable.
Selling: Short positions may be considered once the relevant signals appear in the trading systems being used.
USD/CAD
Analysis:
The bullish wave that began in August continues to develop on the chart of the Canadian dollar's major currency pair. The opposing wave structure, which started on October 5, does not have reversal potential and remains within the boundaries of a corrective movement. The final wave section (C) has been developing since October 23. This wave section remains incomplete at the time of analysis.
Forecast:
Over the next couple of days, the pair is likely to move sideways with a downward bias, potentially reaching the support zone. Subsequently, the upward movement is expected to resume. The highest volatility is expected closer to the weekend. The projected levels indicate the expected weekly trading range for the pair.
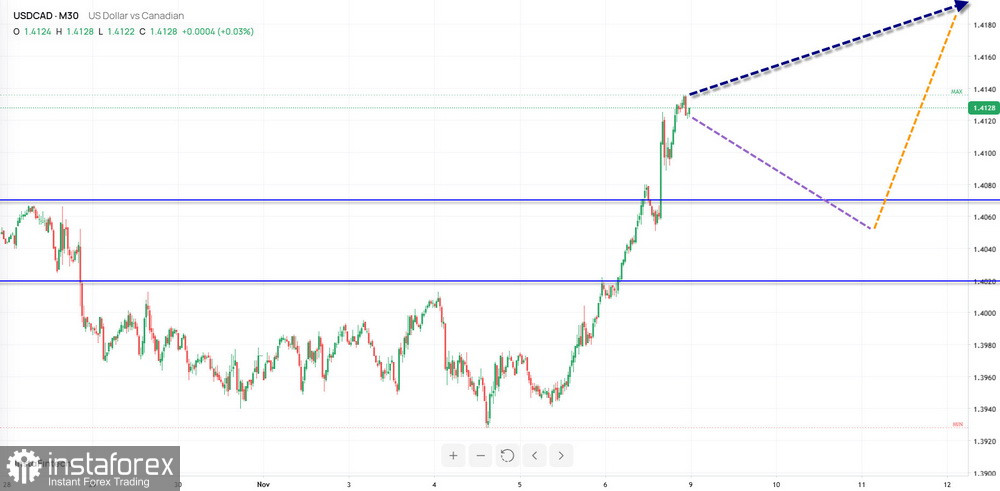
Potential Reversal Zones
Resistance:
- 1.4250/1.4300
Support:
- 1.4070/1.4020
Trading Recommendations:
Buying: Long positions may be considered once confirmed signals appear in the trading systems being used.
Selling: Short positions have limited potential and involve considerable risk.
NZD/USD
Analysis:
Since the beginning of the year, a bearish wave structure in the New Zealand dollar's major currency pair has been developing in the form of a descending flat. At the time of analysis, the final wave section (B) is forming within this structure. It does not yet show signs of completion. The price has reached the boundaries of a broad potential reversal zone on the weekly timeframe.
Weekly Forecast:
During the coming week, the pair is expected to trade predominantly sideways. An upward movement is possible during the first few days. The correction is most likely to end, followed by a change in direction, near the projected resistance zone. A reversal is likely to be accompanied by increased volatility, and a brief break above the upper boundary of the reversal zone cannot be ruled out.
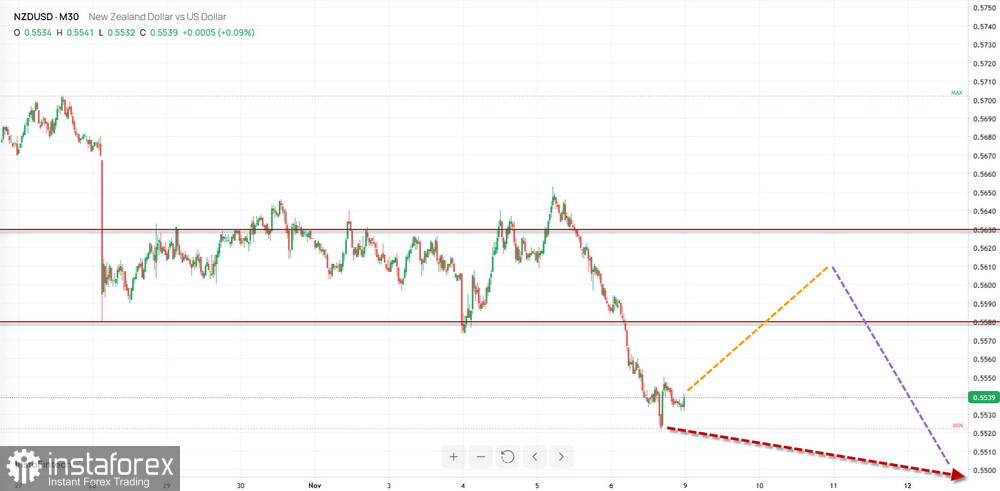
Potential Reversal Zones
Resistance:
- 0.5580/0.5630
Support:
- 0.5490/0.5440
Trading Recommendations
Buying: Long positions may be considered with reduced position sizes during individual trading sessions.
Selling: Short positions may be considered once confirmed signals appear in the upper reversal zone.
EUR/GBP
Analysis:
The unfinished wave structure on the euro/British pound pair chart has been developing downward since April 11. The wave structure takes the form of an expanded flat. The unfinished section constitutes the final part of wave (B). The price is approaching the upper boundary of a potential reversal zone on a higher timeframe.
Weekly Forecast:
Over the next couple of days, the pair is likely to move sideways with an upward bias, potentially reaching the resistance zone. By the end of the week, a reversal and the resumption of the downward movement are expected amid increased volatility. The projected support level indicates the lower boundary of the expected weekly trading range.
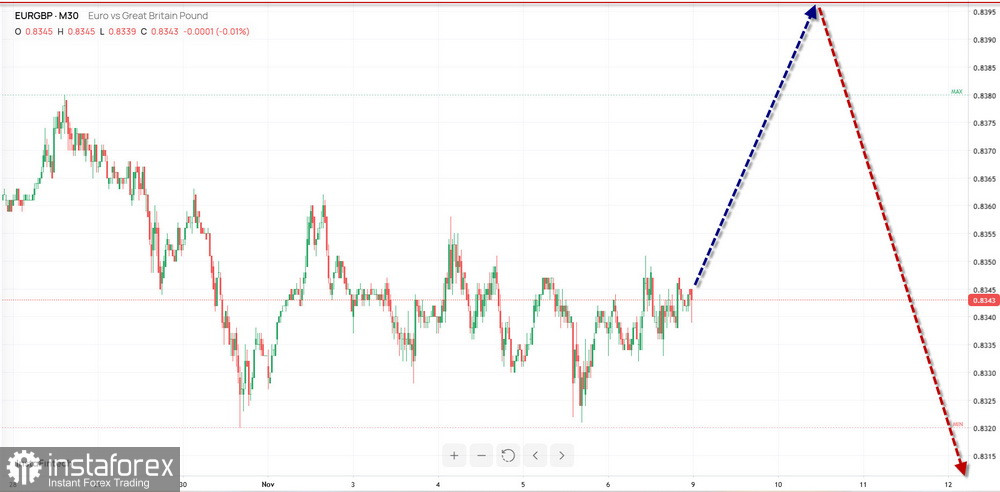
Potential Reversal Zones
Resistance:
- 0.8400/0.8450
Support:
- 0.8270/0.8220
Trading Recommendations
Buying: Long positions may become relevant once reversal signals appear in the trading systems being used near the resistance zone.
Selling: Short positions may be considered with reduced position sizes during individual trading sessions.
Gold
Analysis:
The current wave structure on the short-term timeframe is bearish and has been developing since August 25. Since early October, a corrective wave section (B) has been forming within this structure along a strong resistance level. The wave takes the form of a horizontal running flat and remains incomplete at the time of analysis.
Forecast:
The upward movement in gold is expected to end over the next few days. Sideways consolidation and the formation of conditions for a reversal are likely near the resistance zone. The downward movement is expected to resume toward the end of the week. The projected support level indicates the upper boundary of the instrument's expected weekly trading range.
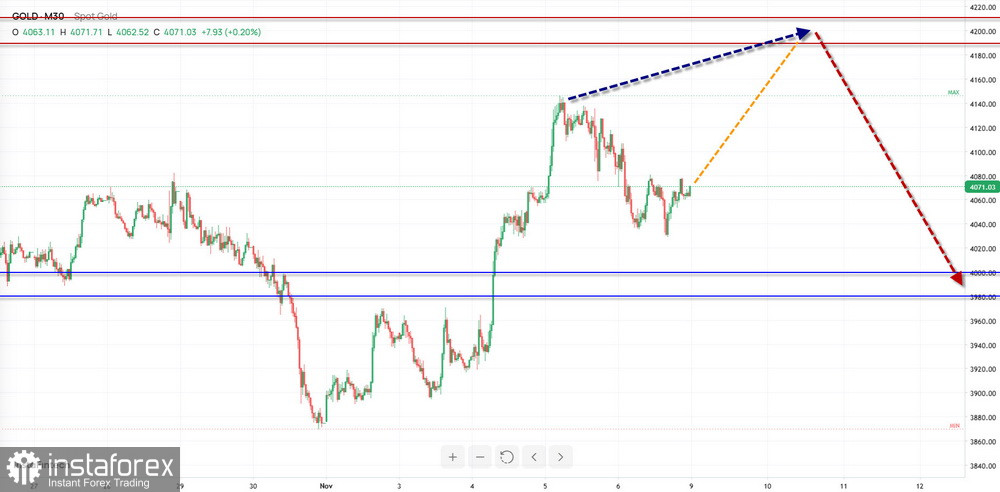
Potential Reversal Zones
Resistance:
- 4190.0/4210.0
Support:
- 4000.0/3980.00
Trading Recommendations:
Selling: Opening short positions before reversal signals appear near the projected resistance level would be premature.
Buying: Long positions may be considered with reduced position sizes during individual trading sessions.
Bitcoin
Analysis:
The unfinished bearish wave structure on the Bitcoin chart has been developing since mid-August. The wave degree of this chart section does not exceed the corrective degree of the upward trend that has been developing since February of this year. The price is currently within a cluster of several potential reversal zones of different scales. No signals of an imminent trend reversal are visible on the chart.
Weekly Forecast:
Over the next couple of days, the downward movement in Bitcoin is likely to continue, potentially reaching the projected support level. An immediate break below its lower boundary is unlikely. By the end of the week, a reversal and the resumption of the upward movement are expected amid increased volatility. The projected resistance level indicates the upper boundary of the expected weekly trading range.
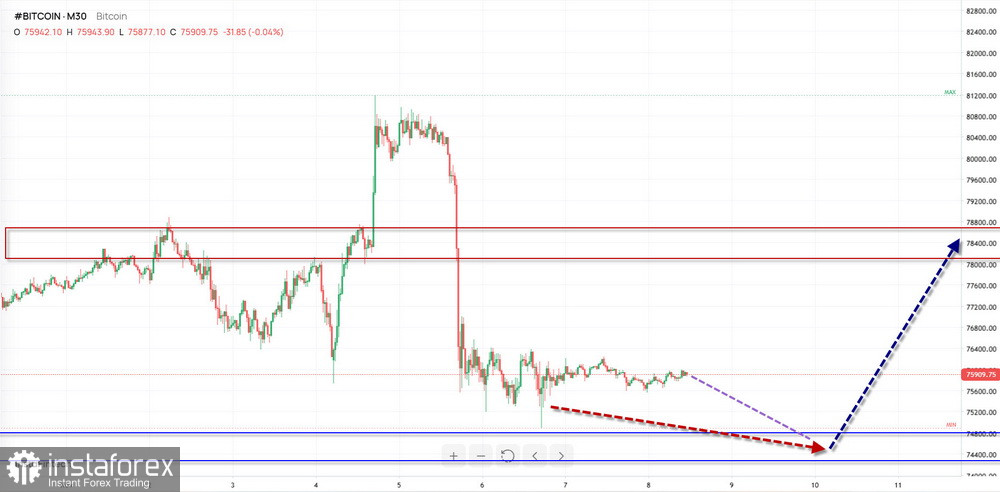
Potential Reversal Zones
Resistance:
- 78100.0/78600.0
Support:
- 74800.0/74300.0
Trading Recommendations
Buying: Long positions may become relevant once reversal signals appear in the trading systems being used near the support zone.
Selling: Short positions may be considered with reduced position sizes during individual trading sessions.
Explanatory Notes: Under Simplified Wave Analysis (SWA), all waves consist of three sections (A-B-C). The most recent unfinished wave is analyzed on each timeframe. Expected price movements are indicated by dashed lines.
Important: The wave algorithm does not take into account the duration of price movements over time!