 English

 Русский
 Bahasa Indonesia
 Bahasa Malay
 ไทย
 Español
 Deutsch
 Български
 Français
 Tiếng Việt
 中文
 বাংলা
 हिन्दी
 Čeština
 Українська
 Română



The NASDAQ-100 index is trading around 27,625.0. Today, the index is bouncing nearly 2% amid the first day of trading in Anthropic shares, but overall it has fallen about 12% from the October high of 31,300 and earlier this week tested 26,573.3. The Fed minutes confirmed that almost all committee members expect further rate hikes, and the 10?year US Treasury yield is holding around 5.1%. Price has returned to a key node where the weekly EMA?50, the H4 EMA?50 and the H1 EMA?200 converge.
Fundamental and market backdrop
Index dynamics. NASDAQ?100 trades near 27,625.0. The week opened at 28,120.2, the week low is 26,573.3, and the high is 28,189.1. Yesterday, the Nasdaq Composite rose 0.4%, and NASDAQ?100 futures are up about 1.8% today. Bearish and bullish drivers. The prospect of Fed rate hikes weighs on the market: almost all committee members consider additional hikes appropriate, and Fed Governor Christopher Waller allowed for a 50 bp move in December. Nvidia shares are down for a fifth day despite a strong report. Offsetting support comes from Anthropic's record IPO and gains in chipmakers and cybersecurity stocks.
Upcoming events. Today is Anthropic's first trading day, Walmart reports, and weekly initial jobless claims are released. Fed meeting on 8–9 December.
Technical analysis — "Second Wave" strategy
The analysis uses EMA?50 (green), EMA?100 (yellow), EMA?200 (red), plus RSI (14) and MACD (12,26,9). The goal is to determine whether a "Second Wave" pattern is formed or conditions for entry are absent.
Weekly chart (W1)
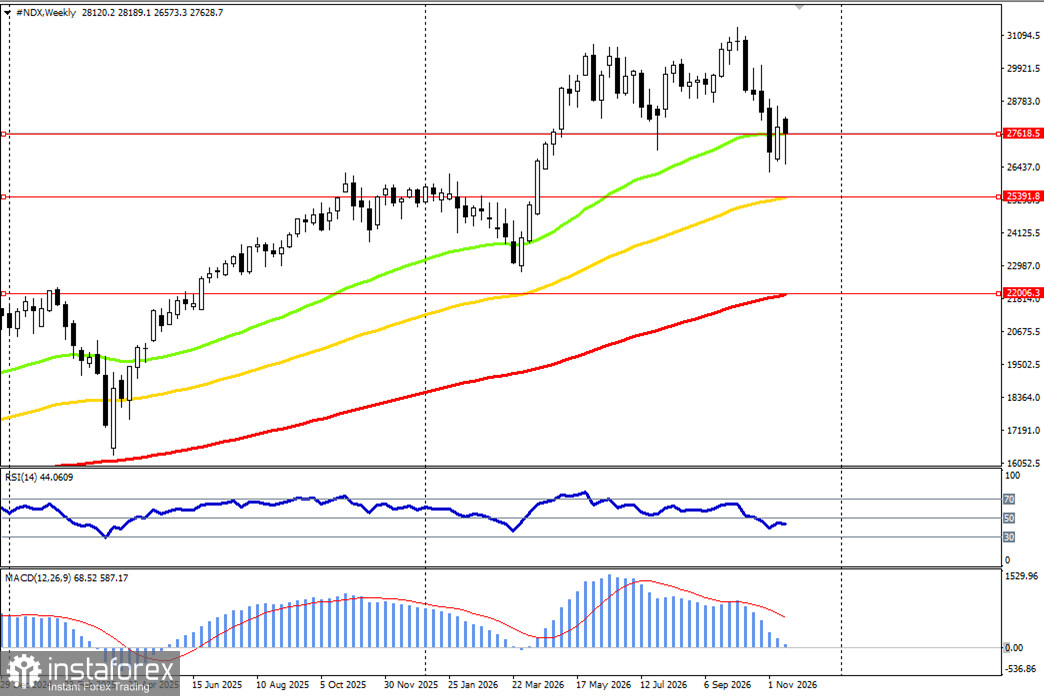
Weekly EMAs are aligned bullishly: EMA?50 (27,618.5) is above EMA?100 (25,391.8), which is well above EMA?200 (22,006.3). The long?term uptrend remains intact. But after the October high at 31,300, the index has been in a correction. This week, the price fell below the EMA?50 for the first time since spring — to 26,573.3 — but returned to it and is now trading right at that average. RSI (14) on W1 is 44 — neutral. MACD is above zero but well below the signal line; the histogram is rapidly contracting toward zero. W1 conclusion: long?term trend is up, but momentum is weakening. Weekly EMA?50 (27,618.5) is a key support. A weekly close below it would be a serious sign of weakness.
Daily chart (D1)
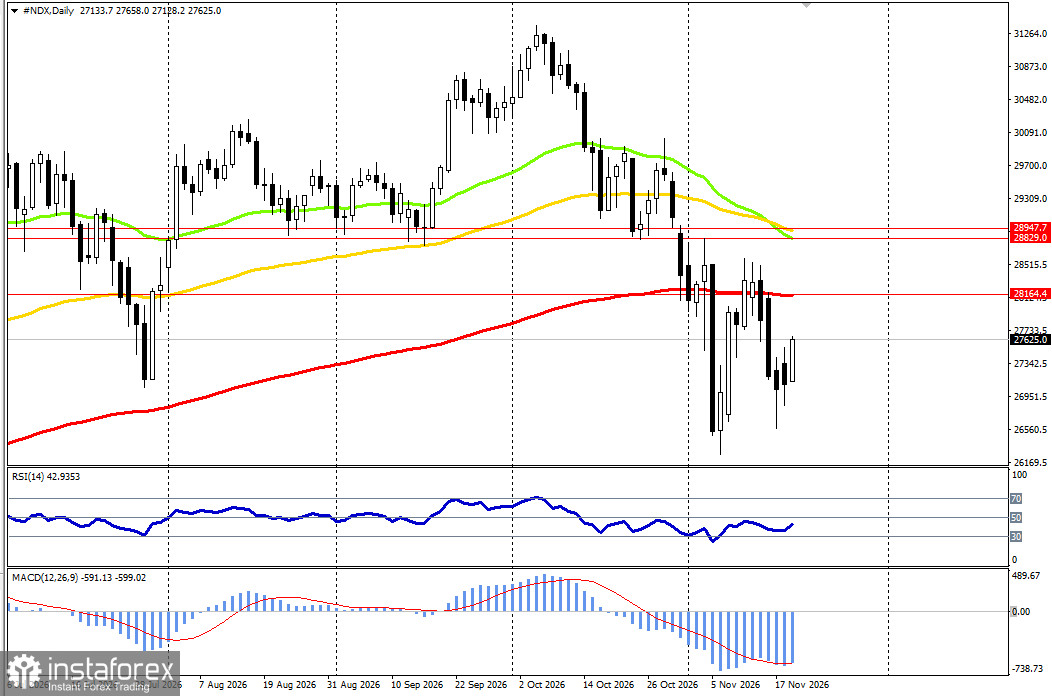
On the daily chart, the price is below all three EMAs: EMA?50 28,829.0, EMA?100 28,947.7, EMA?200 28,164.4. EMA?50 has dropped below EMA?100, and both are pointing down. In late October the index broke EMA?50 and EMA?100, and in early November broke EMA?200. From 11–13 November, the price bounced above EMA?200 but failed to hold and fell again to the 26,573.3 low. Today, the index is bouncing. That means that even if the bounce continues, the price will remain below the daily averages: the nearest resistance is the D1 EMA?200 (28,164.4). RSI (14) on D1 is 42 — neutral, not oversold. MACD is below zero, with the main line just crossing above the signal line: the decline is slowing. D1 conclusion: the medium?term structure is bearish. Priority is to sell, but not aggressively — wait for a retracement to the D1 EMA?200 and reversal from there.
4?hour chart (H4)
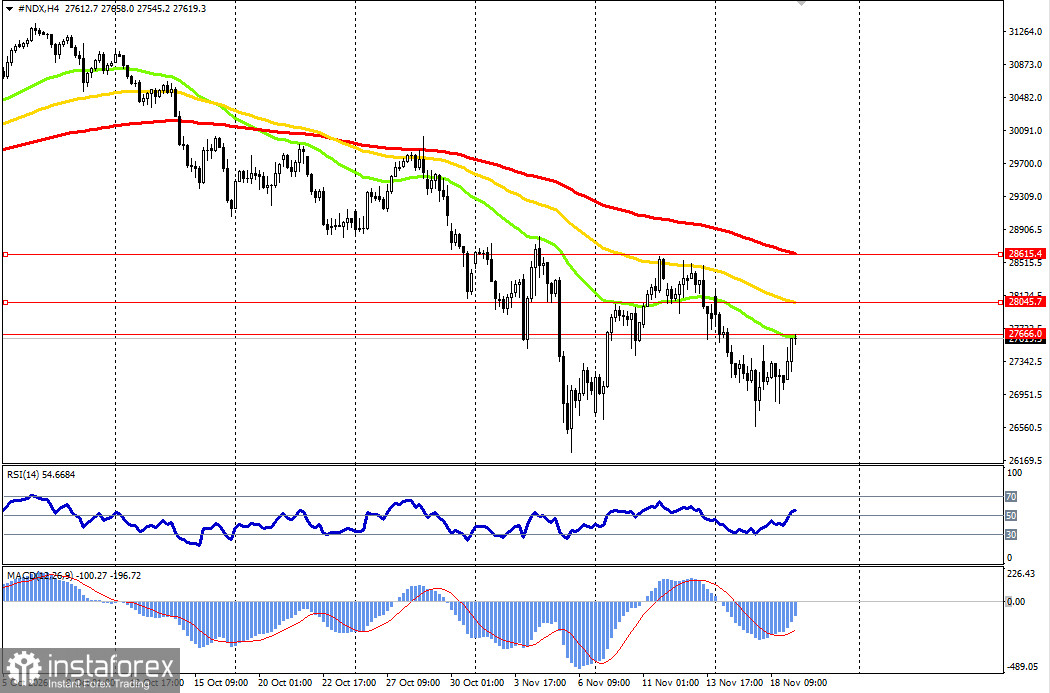
On H4, the EMAs are in bearish order: EMA?200 28,615.4, EMA?100 28,045.7, EMA?50 27,666.0. The 11–13 November bounce stalled at the EMA?200, after which the index made a new low. Now price has risen to test the EMA?50 from below. Important: the H4 EMA?100 (28,045.7) sits close to the D1 EMA?200 (28,164.4). Two EMAs from different timeframes converge around 28,050–28,170, making that zone a particularly significant resistance. RSI (14) on H4 is 54. MACD is below zero but above the signal line and rising. H4 conclusion: a local bounce is in progress, but the H4 trend remains down. Expect a move toward 28,050–28,170 and look for reversal signs there.
1-hour chart (H1)
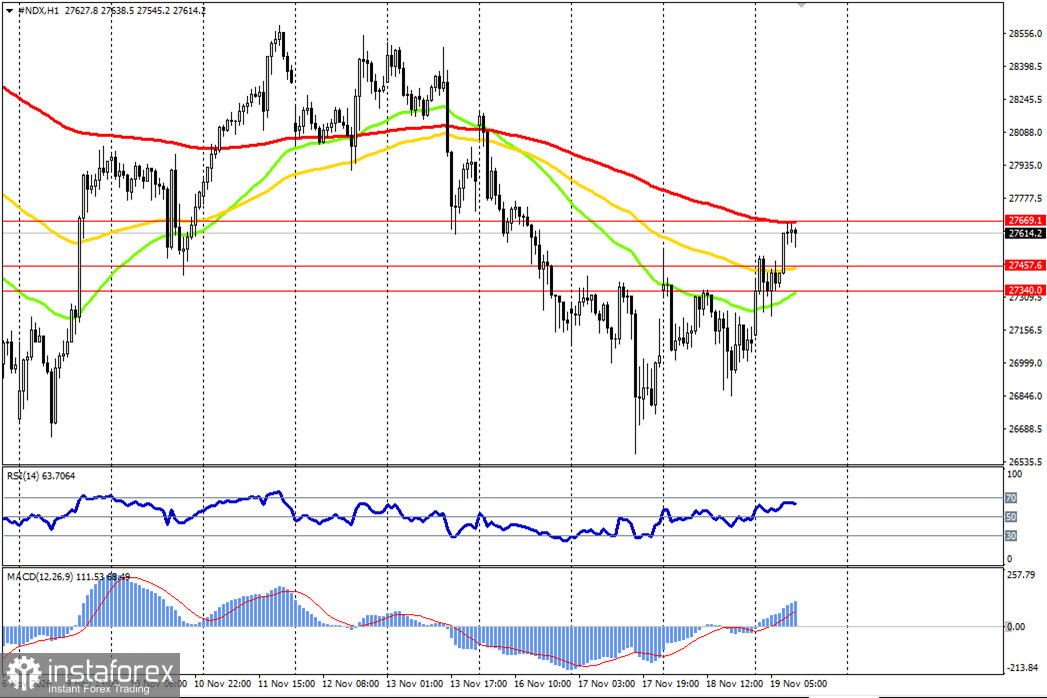
On H1, the EMAs are bearish: EMA?200 27,669.1, EMA?100 27,457.6, EMA?50 27,340.0. On 17–18 November, the index traded in a 26,880–27,400 range; today it broke that range to the upside and rose above EMA?50 and EMA?100. Important: the H1 EMA?200 (27,669.1) nearly coincides with the H4 EMA?50 (27,666.0) and the W1 EMA?50 (27,618.5). Three EMAs from three timeframes converge here — this is the nearest resistance. RSI (14) on H1 is 63, approaching overbought. MACD is above zero and above the signal line. H1 conclusion: local upside momentum is present. No trade signal yet. Nearest resistance: 27,620–27,670, support 27,340.
Overall "Second Wave" summary
Higher?timeframe trend summary. On the weekly chart, the trend is up, and the price sits at the EMA?50 — a classic support zone. On the daily chart, the structure is down: price is below all three EMAs. Under the system rules, the daily chart defines the main direction, so buying against it is not considered. Nor will we sell immediately at weekly support on the rebound. Current point. There is no oversold reading: RSI on D1 is 42. RSI on H1 is 63, so the market is locally extended. Selling now would be selling at weekly support amid a mid?bounce. It is better to wait for the bounce to reach D1 resistance.
What we expect:
- A retracement up to the 28,050–28,170 zone (H4 EMA?100 and D1 EMA?200);
- RSI on H4 should rise toward 55–65 and then turn down without exceeding 70;
- MACD on H4 should cross from above to below;
- Confirmation on H1: reversal from that zone and a close below H1 EMA?200.
Current status: signal forming / waiting zone.
Scenarios
Primary scenario (sell from resistance after retracement)
Logic: wait for the bounce to 28,050–28,170 where H4 EMA?100 and D1 EMA?200 coincide.
If H4 RSI turns down and MACD gives a top?down cross, enter a short in line with the daily trend. The first target is limited by the weekly EMA?50 zone.
Entry: Sell Limit 28,100; Stop?Loss: 28,450 (above the resistance zone); Take?Profit 1: 27,650; Take?Profit 2: 27,000; Risk: 350 points, potential 450 and 1,100 points. Hold the second target only if the index closes the week below the weekly EMA?50. If stopped out, the next entry point is H4 EMA?200 (28,615.4): Sell Limit 28,600, Stop?Loss 29,000 (above D1 EMA?50 28,829.0). Targets: 28,100 and 27,700.
Alternative scenario (upside breakout without retracement)
If the index impulsively breaks through 28,050–28,170 and holds above the D1 EMA?200, stop considering shorts. We will not buy the impulse: H1 and H4 RSI will be near overbought. Wait for a pullback to the broken zone from above and only then evaluate long entries.
Long scenario
The weekly trend is up, so a resumption of growth from the weekly EMA?50 is possible. Under the system, a buy is considered only after the daily structure changes: a close above D1 EMA?200 (28,164.4). In that case: Buy Limit 28,200 on a retest, Stop?Loss 27,850, targets 28,800 and 29,200. For now, trade shorts only and only from resistance.
Scenarios for short?term traders
For aggressive/intraday traders, the working range is 27,340–27,670. These trades are not "Second Wave" signals, so reduce position size.
Today is Anthropic's first trading day, so volatility may be high.
Sell from resistance at the triple?EMA node: Sell Limit 27,660, Stop?Loss 27,800, targets 27,460 and 27,340. Buy from support at H1 EMA?50: Buy Limit 27,350, Stop?Loss 27,200, targets 27,550 and 27,650. Upside breakout. On hourly close above 27,700: Buy Stop 27,720, Stop?Loss 27,560, targets 27,900 and 28,040. H1 RSI is near overbought — this is a risky trade. Downside breakout. On hourly close below 27,340: Sell Stop 27,300, Stop?Loss 27,470, targets 27,130 and 26,900.
Important. Today is Anthropic's first trading day, Walmart reports, and US labor market data are due. Sharp moves are possible in the early US session. Do not open positions minutes before releases and always use stop?losses.