 English
  Русский
 Bahasa Indonesia
 Bahasa Malay
 ไทย
ไทย Español
 Deutsch
 Български
 Français
 Tiếng Việt
 中文
中文 বাংলা
বাংলা हिन्दी
 Čeština
 Українська
 Română
 The Triple Bottom pattern has formed on the chart of the #TSLA M5 trading instrument. The pattern signals a change in the trend from downwards to upwards in the case of breakdown of 306.20/306.12.
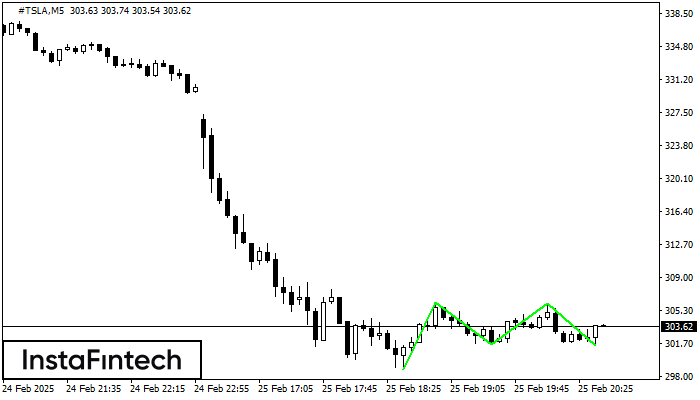
 The M5 and M15 time frames may have more false entry points.