 English
  Русский
 Bahasa Indonesia
 Bahasa Malay
 ไทย
ไทย Español
 Deutsch
 Български
 Français
 Tiếng Việt
 中文
中文 বাংলা
বাংলা हिन्दी
 Čeština
 Українська
 Română
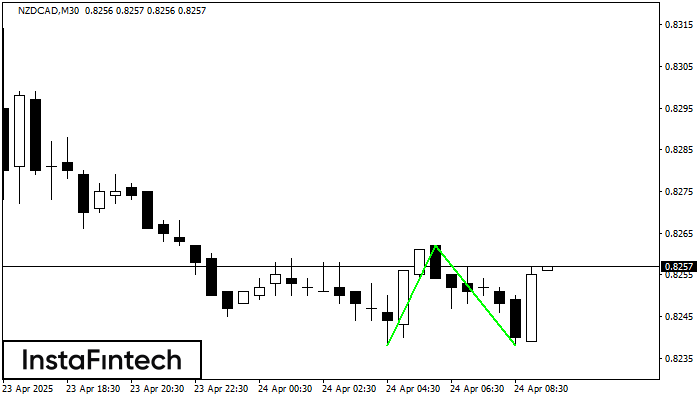 The Double Bottom pattern has been formed on NZDCAD M30. This formation signals a reversal of the trend from downwards to upwards. The signal is that a buy trade should be opened after the upper boundary of the pattern 0.8262 is broken. The further movements will rely on the width of the current pattern 24 points.
 FX.co ★ NZDCAD M30: Double Bottom
Signal strength 3 of 5
NZDCAD M30: Double Bottom
The Double Bottom pattern has been formed on NZDCAD M30. This formation signals a reversal of the trend from downwards to upwards. The signal is that a buy trade should be opened after the upper boundary of the pattern 0.8262 is broken. The further movements will rely on the width of the current pattern 24 points. *The market analysis posted here is meant to increase your awareness, but not to give instructions to make a trade