 English
  Русский
 Bahasa Indonesia
 Bahasa Malay
 ไทย
ไทย Español
 Deutsch
 Български
 Français
 Tiếng Việt
 中文
中文 বাংলা
বাংলা हिन्दी
 Čeština
 Українська
 Română
 According to the chart of M5, #AAPL formed the Bearish Symmetrical Triangle pattern. Description: The lower border is 202.57/203.12 and upper border is 203.75/203.12. The pattern width is measured on the chart at -118 pips. The formation of the Bearish Symmetrical Triangle pattern evidently signals a continuation of the downward trend. In other words, if the scenario comes true and #AAPL breaches the lower border, the price could continue its move toward 202.97.
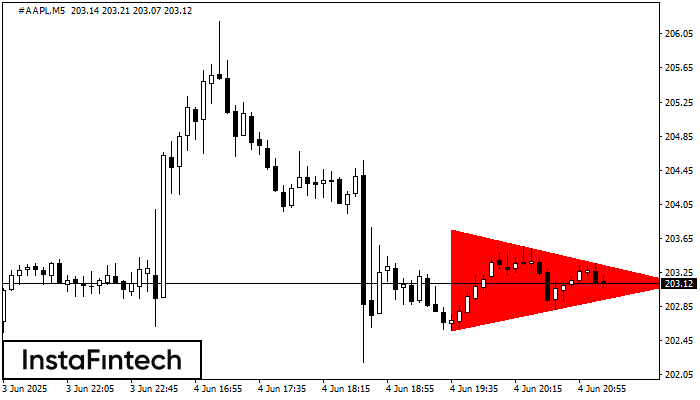
 The M5 and M15 time frames may have more false entry points.