 English
  Русский
 Bahasa Indonesia
 Bahasa Malay
 ไทย
ไทย Español
 Deutsch
 Български
 Français
 Tiếng Việt
 中文
中文 বাংলা
বাংলা हिन्दी
 Čeština
 Українська
 Română
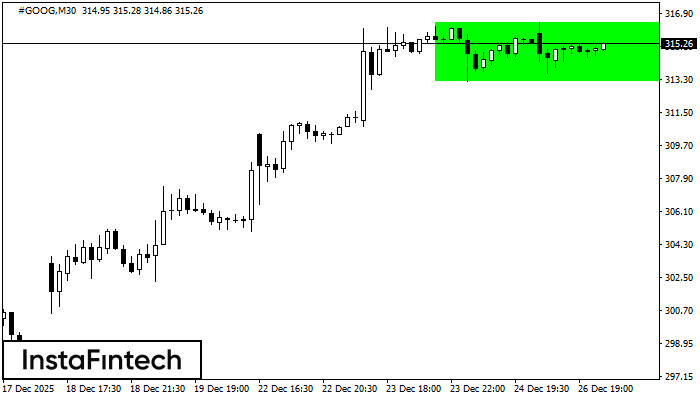 According to the chart of M30, #GOOG formed the Bullish Rectangle. This type of a pattern indicates a trend continuation. It consists of two levels: resistance 316.41 and support 313.18. In case the resistance level 316.41 - 316.41 is broken, the instrument is likely to follow the bullish trend.
 FX.co ★ #GOOG M30: Bullish Rectangle
Signal strength 3 of 5
#GOOG M30: Bullish Rectangle
According to the chart of M30, #GOOG formed the Bullish Rectangle. This type of a pattern indicates a trend continuation. It consists of two levels: resistance 316.41 and support 313.18. In case the resistance level 316.41 - 316.41 is broken, the instrument is likely to follow the bullish trend. *The market analysis posted here is meant to increase your awareness, but not to give instructions to make a trade