 Français
  Русский
 English
 Bahasa Indonesia
 Bahasa Malay
 ไทย
ไทย Español
 Deutsch
 Български
 Tiếng Việt
 中文
中文 বাংলা
বাংলা हिन्दी
 Čeština
 Українська
 Română
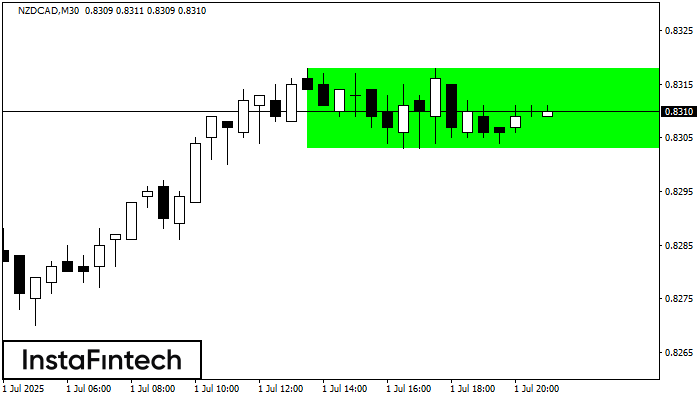 According to the chart of M30, NZDCAD formed the Bullish Rectangle which is a pattern of a trend continuation. The pattern is contained within the following borders: the lower border 0.8303 – 0.8303 and upper border 0.8318 – 0.8318. In case the upper border is broken, the instrument is likely to follow the upward trend.
 FX.co ★ NZDCAD M30: Bullish Rectangle
Signal strength 3 of 5
NZDCAD M30: Bullish Rectangle
According to the chart of M30, NZDCAD formed the Bullish Rectangle which is a pattern of a trend continuation. The pattern is contained within the following borders: the lower border 0.8303 – 0.8303 and upper border 0.8318 – 0.8318. In case the upper border is broken, the instrument is likely to follow the upward trend. *L'analyse de marché présentée est de nature informative et n'est pas une incitation à effectuer une transaction