 Français
 Русский
 English
 Bahasa Indonesia
 Bahasa Malay
 ไทย
ไทย Español
 Deutsch
 Български
 Tiếng Việt
 中文
中文 বাংলা
বাংলা हिन्दी
 Čeština
 Українська
 Română

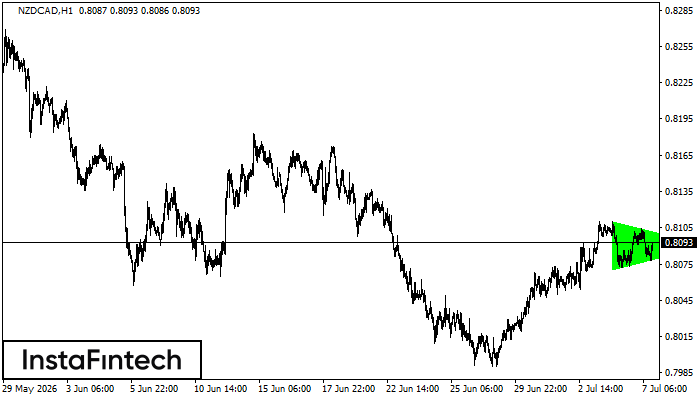 According to the chart of H1, NZDCAD formed the Bullish Symmetrical Triangle pattern. The lower border of the pattern touches the coordinates 0.8070/0.8090 whereas the upper border goes across 0.8110/0.8090. If the Bullish Symmetrical Triangle pattern is in progress, this evidently signals a further upward trend. In other words, in case the scenario comes true, the price of NZDCAD will breach the upper border to head for 0.8130.
 FX.co ★ NZDCAD H1: Bullish Symmetrical Triangle
Signal strength 4 of 5
NZDCAD H1: Bullish Symmetrical Triangle
According to the chart of H1, NZDCAD formed the Bullish Symmetrical Triangle pattern. The lower border of the pattern touches the coordinates 0.8070/0.8090 whereas the upper border goes across 0.8110/0.8090. If the Bullish Symmetrical Triangle pattern is in progress, this evidently signals a further upward trend. In other words, in case the scenario comes true, the price of NZDCAD will breach the upper border to head for 0.8130. *L'analyse de marché présentée est de nature informative et n'est pas une incitation à effectuer une transaction