 Français
  Русский
 English
 Bahasa Indonesia
 Bahasa Malay
 ไทย
ไทย Español
 Deutsch
 Български
 Tiếng Việt
 中文
中文 বাংলা
বাংলা हिन्दी
 Čeština
 Українська
 Română
FX.co ★ Modèles réels. Analyse technique et recommandations de trading

Modèles d'analyse technique
There is nothing more precious to a trader than an ability to predict a further price movement. Technical analysis is a key to your successful transaction. At the same time, you can rely on common and recurring situations that arise in the same circumstances. Our Technical Analysis Patterns section features all trading recommendations based on the technical analysis patterns that help traders make projections and turn a profit.
Outil:
1 sélectionné
#Bitcoin
EURCHF
EURGBP
EURJPY
EURUSD
EURCAD
EURRUB
EURNZD
USDCAD
USDCHF
USDJPY
USDRUB
NZDCAD
NZDUSD
NZDCHF
NZDJPY
AUDCAD
AUDCHF
AUDJPY
AUDUSD
GBPUSD
GBPJPY
GBPAUD
GBPCHF
GOLD
SILVER
#AAPL
#AMZN
#EBAY
#FB
#GOOG
#MCD
#MA
#KO
#INTC
#MSFT
#NTDOY
#PEP
#TSLA
#TWTR
Figure:
All
Triangle
Rectangle
Pennant
Flag
Head and Shoulders
Double Top
Triple top
Timeframe:
All
M5
M15
M30
H1
D1
Signal strength:
All
High
Medium
Low
Signal direction:
All
Buy
Sell
#MCD
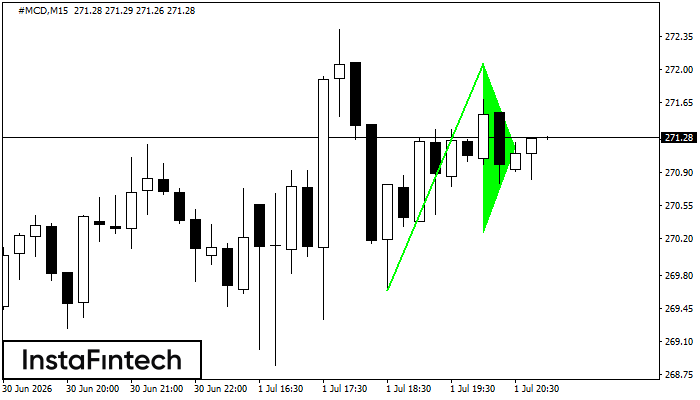
#MCD M15
Bullish pennant
The Bullish pennant pattern is formed on the #MCD M15 chart. It is a type of the continuation pattern. Supposedly, in case the price is fixed above the pennant’s high of 272.07, a further uptrend is possible.
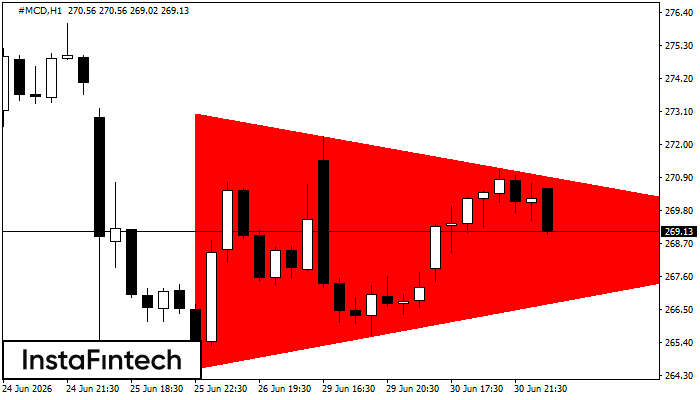
#MCD H1
Bearish Symmetrical Triangle
According to the chart of H1, #MCD formed the Bearish Symmetrical Triangle pattern. Trading recommendations: A breach of the lower border 264.56 is likely to encourage a continuation of the downward trend.
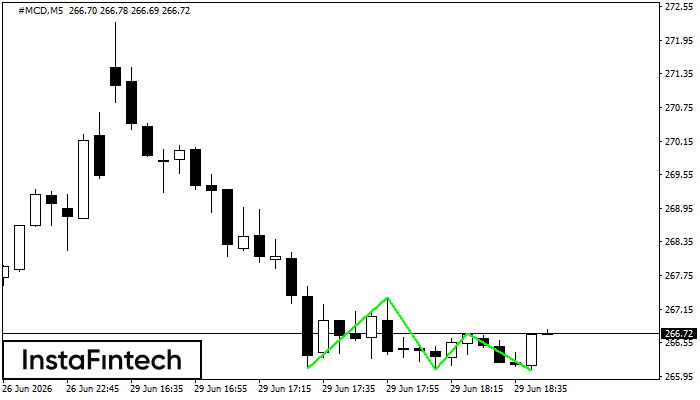
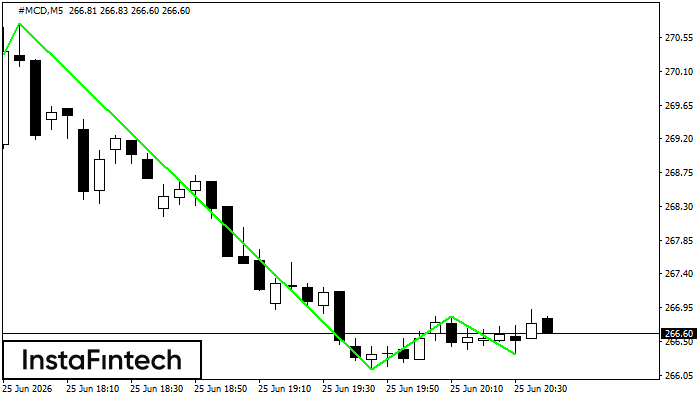
#MCD M5
Triple Bottom
The Triple Bottom pattern has formed on the chart of #MCD M5. Features of the pattern: The lower line of the pattern has coordinates 267.36 with the upper limit 267.36/266.72, the projection of the width is 128 points. The formation of the Triple Bottom pattern most likely indicates a change in the trend from downward to upward. This means that in the event of a breakdown of the resistance level 266.08, the price is most likely to continue the upward movement.
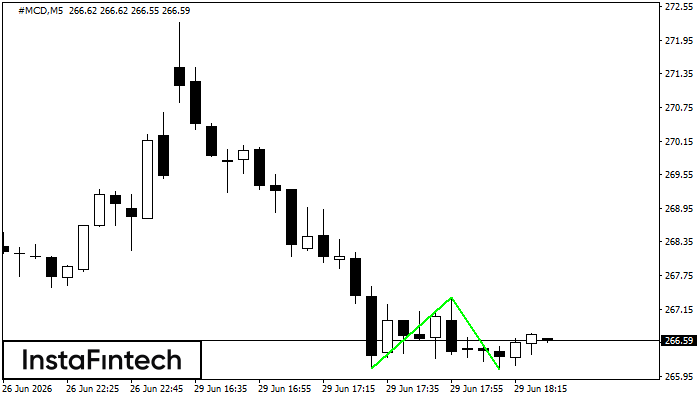
#MCD M5
Double Bottom
The Double Bottom pattern has been formed on #MCD M5. Characteristics: the support level 266.08; the resistance level 267.36; the width of the pattern 128 points. If the resistance level is broken, a change in the trend can be predicted with the first target point lying at the distance of 129 points.
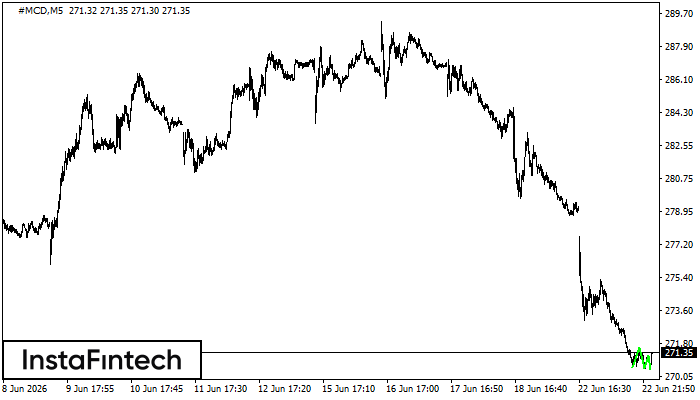
#MCD M5
Triple Bottom
The Triple Bottom pattern has formed on the chart of #MCD M5. Features of the pattern: The lower line of the pattern has coordinates 270.74 with the upper limit 270.74/266.84, the projection of the width is 523 points. The formation of the Triple Bottom pattern most likely indicates a change in the trend from downward to upward. This means that in the event of a breakdown of the resistance level 265.51, the price is most likely to continue the upward movement.
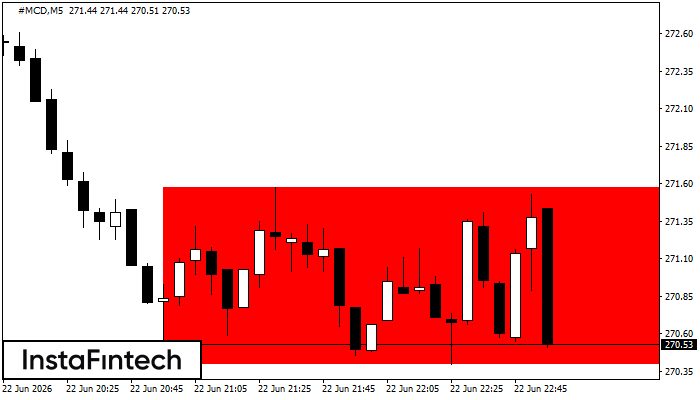
#MCD M5
Bearish Rectangle
According to the chart of M5, #MCD formed the Bearish Rectangle. The pattern indicates a trend continuation. The upper border is 271.58, the lower border is 270.40. The signal means that a short position should be opened after fixing a price below the lower border 270.40 of the Bearish Rectangle.
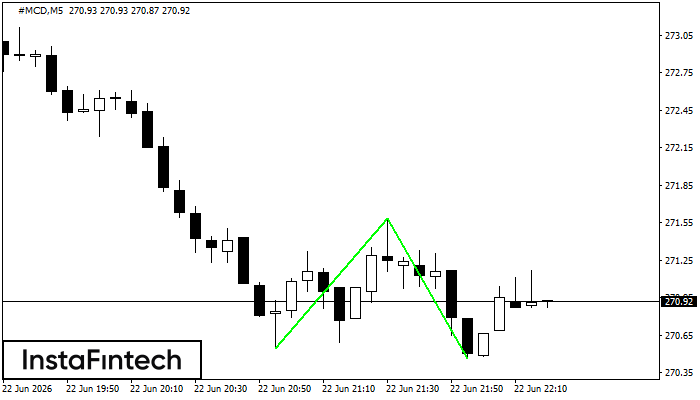
#MCD M5
Triple Bottom
The Triple Bottom pattern has formed on the chart of the #MCD M5 trading instrument. The pattern signals a change in the trend from downwards to upwards in the case of breakdown of 271.58/271.17.
#MCD M5
Double Bottom
The Double Bottom pattern has been formed on #MCD M5. Characteristics: the support level 270.54; the resistance level 271.58; the width of the pattern 104 points. If the resistance level is broken, a change in the trend can be predicted with the first target point lying at the distance of 112 points.
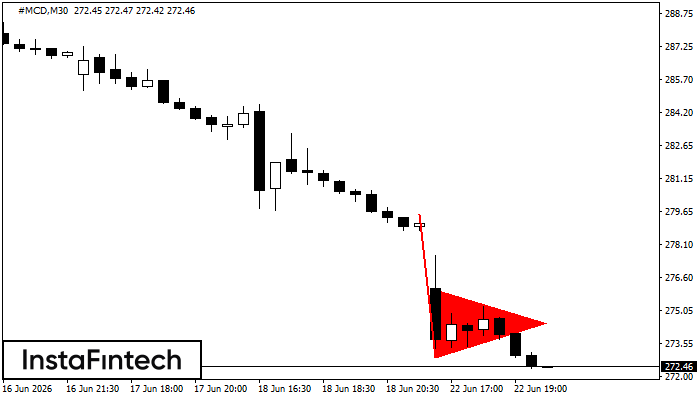
#MCD M30
Bearish pennant
The Bearish pennant pattern has formed on the #MCD M30 chart. It signals potential continuation of the existing trend. Specifications: the pattern’s bottom has the coordinate of 272.91; the projection of the flagpole height is equal to 657 pips. In case the price breaks out the pattern’s bottom of 272.91, the downtrend is expected to continue for further level 272.61.
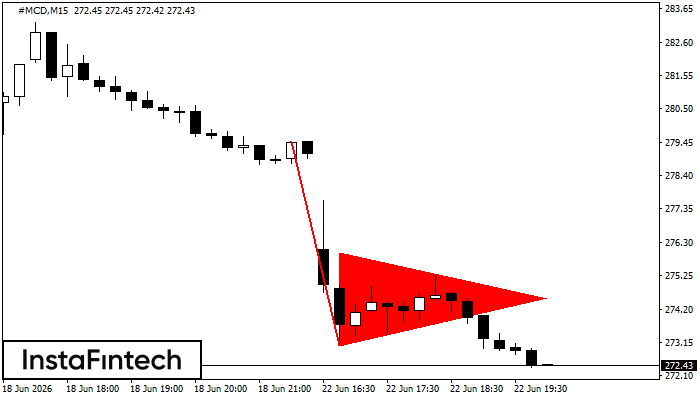
#MCD M15
Bearish pennant
The Bearish pennant pattern has formed on the #MCD M15 chart. The pattern signals continuation of the downtrend in case the pennant’s low of 273.05 is broken through. Recommendations: Place the sell stop pending order 10 pips below the pattern’s low. Place the take profit order at the projection distance of the flagpole height.