 Français
  Русский
 English
 Bahasa Indonesia
 Bahasa Malay
 ไทย
ไทย Español
 Deutsch
 Български
 Tiếng Việt
 中文
中文 বাংলা
বাংলা हिन्दी
 Čeština
 Українська
 Română
FX.co ★ Modèles réels. Analyse technique et recommandations de trading

Modèles d'analyse technique
There is nothing more precious to a trader than an ability to predict a further price movement. Technical analysis is a key to your successful transaction. At the same time, you can rely on common and recurring situations that arise in the same circumstances. Our Technical Analysis Patterns section features all trading recommendations based on the technical analysis patterns that help traders make projections and turn a profit.
Outil:
1 sélectionné
#Bitcoin
EURCHF
EURGBP
EURJPY
EURUSD
EURCAD
EURRUB
EURNZD
USDCAD
USDCHF
USDJPY
USDRUB
NZDCAD
NZDUSD
NZDCHF
NZDJPY
AUDCAD
AUDCHF
AUDJPY
AUDUSD
GBPUSD
GBPJPY
GBPAUD
GBPCHF
GOLD
SILVER
#AAPL
#AMZN
#EBAY
#FB
#GOOG
#MCD
#MA
#KO
#INTC
#MSFT
#NTDOY
#PEP
#TSLA
#TWTR
Figure:
All
Triangle
Rectangle
Pennant
Flag
Head and Shoulders
Double Top
Triple top
Timeframe:
All
M5
M15
M30
H1
D1
Signal strength:
All
High
Medium
Low
Signal direction:
All
Buy
Sell
#INTC
#INTC M5
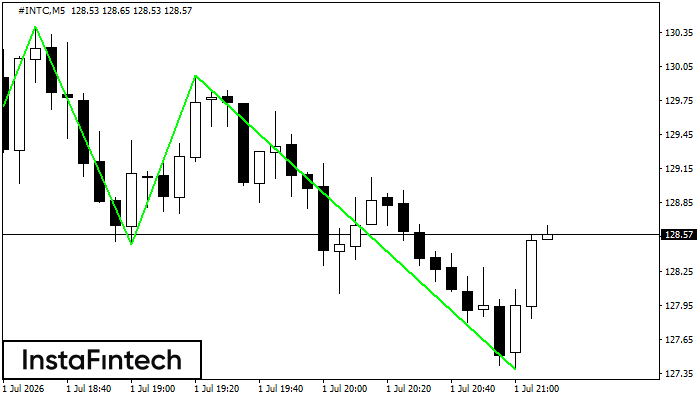
Triple Bottom
The Triple Bottom pattern has formed on the chart of #INTC M5. Features of the pattern: The lower line of the pattern has coordinates 130.40 with the upper limit 130.40/129.97, the projection of the width is 244 points. The formation of the Triple Bottom pattern most likely indicates a change in the trend from downward to upward. This means that in the event of a breakdown of the resistance level 127.96, the price is most likely to continue the upward movement.
#INTC M5
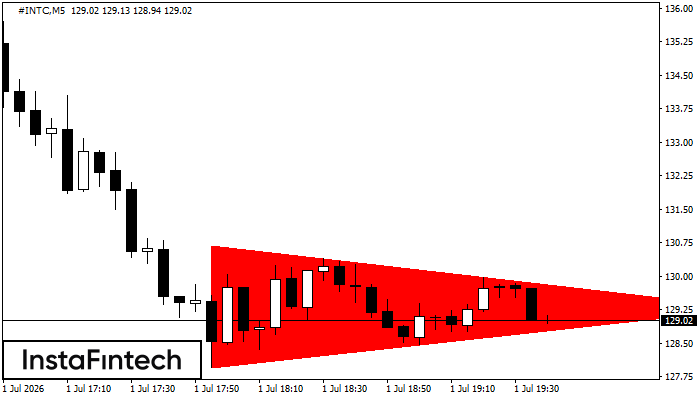
Bearish Symmetrical Triangle
According to the chart of M5, #INTC formed the Bearish Symmetrical Triangle pattern. This pattern signals a further downward trend in case the lower border 127.96 is breached. Here, a hypothetical profit will equal the width of the available pattern that is -274 pips.
#INTC H1
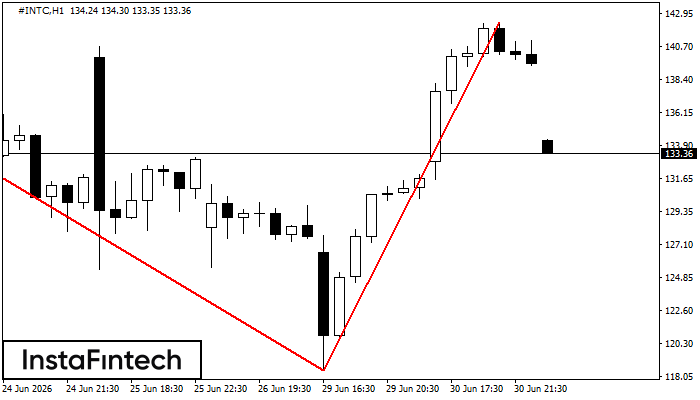
Double Top
The Double Top reversal pattern has been formed on #INTC H1. Characteristics: the upper boundary 141.42; the lower boundary 118.51; the width of the pattern is 2381 points. Sell trades are better to be opened below the lower boundary 118.51 with a possible movements towards the 118.11 level.
#INTC M5
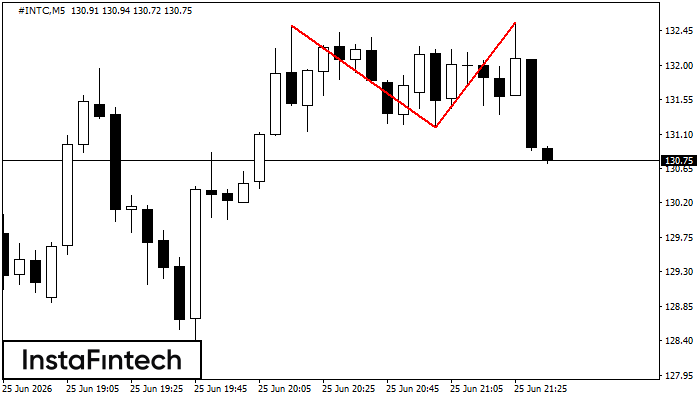
Double Top
On the chart of #INTC M5 the Double Top reversal pattern has been formed. Characteristics: the upper boundary 132.56; the lower boundary 131.19; the width of the pattern 137 points. The signal: a break of the lower boundary will cause continuation of the downward trend targeting the 131.04 level.
#INTC M15
Double Bottom
The Double Bottom pattern has been formed on #INTC M15; the upper boundary is 136.05; the lower boundary is 127.98. The width of the pattern is 768 points. In case of a break of the upper boundary 136.05, a change in the trend can be predicted where the width of the pattern will coincide with the distance to a possible take profit level.
#INTC M5
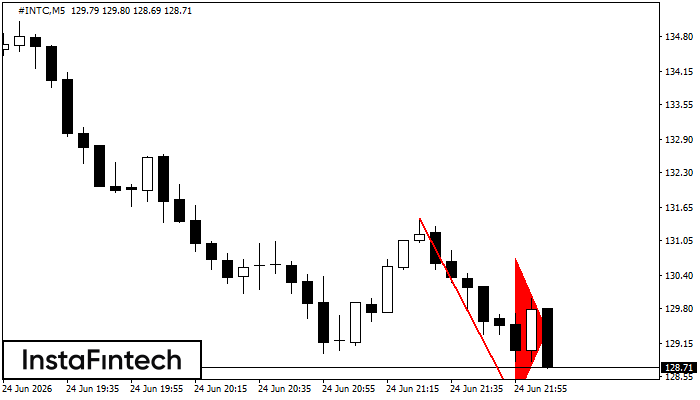
Bearish pennant
The Bearish pennant pattern has formed on the #INTC M5 chart. The pattern signals continuation of the downtrend in case the pennant’s low of 128.07 is broken through. Recommendations: Place the sell stop pending order 10 pips below the pattern’s low. Place the take profit order at the projection distance of the flagpole height.
#INTC M5
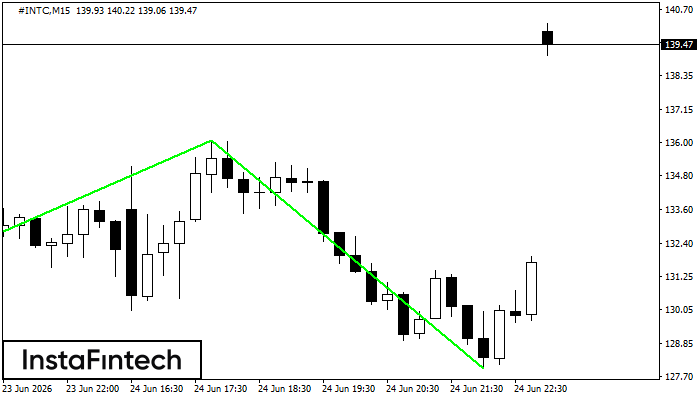
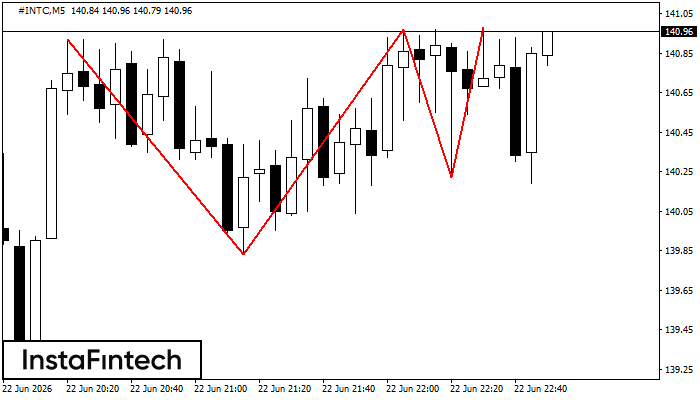
Triple Top
The Triple Top pattern has formed on the chart of the #INTC M5. Features of the pattern: borders have an ascending angle; the lower line of the pattern has the coordinates 139.83/140.22 with the upper limit 140.92/140.98; the projection of the width is 109 points. The formation of the Triple Top figure most likely indicates a change in the trend from upward to downward. This means that in the event of a breakdown of the support level of 139.83, the price is most likely to continue the downward movement.
#INTC M15
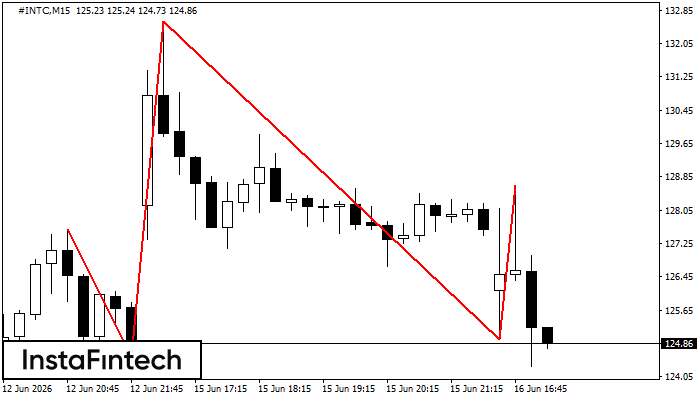
Head and Shoulders
The #INTC M15 formed the Head and Shoulders pattern with the following features: The Head’s top is at 132.57, the Neckline and the upward angle are at 124.55/124.94. The formation of this pattern can bring about changes in the current trend from bullish to bearish. In case the pattern triggers the expected changes, the price of #INTC will go towards 124.71.
#INTC M5
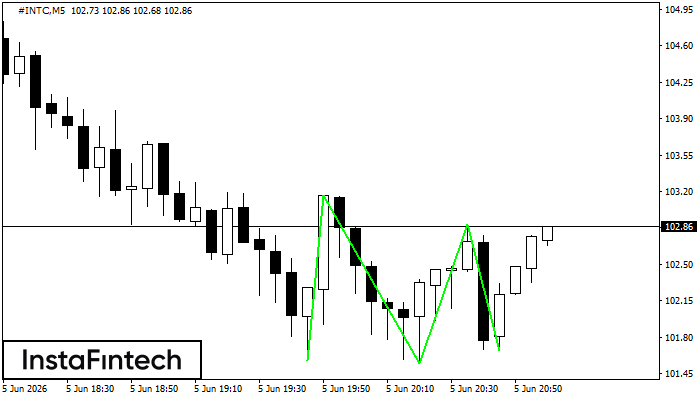
Triple Bottom
The Triple Bottom pattern has been formed on #INTC M5. It has the following characteristics: resistance level 103.16/102.88; support level 101.58/101.67; the width is 158 points. In the event of a breakdown of the resistance level of 103.16, the price is likely to continue an upward movement at least to 101.70.
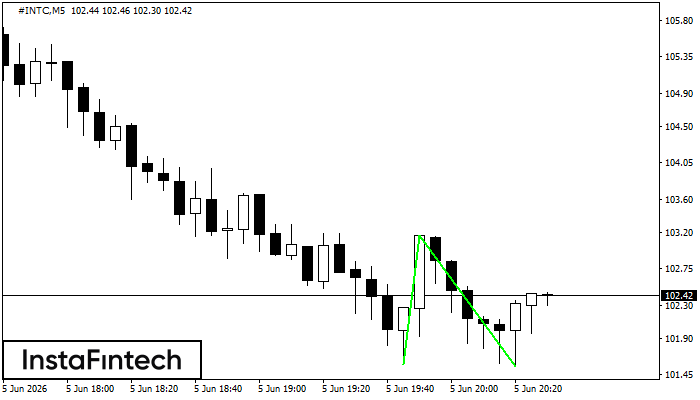
#INTC M5
Double Bottom
The Double Bottom pattern has been formed on #INTC M5. Characteristics: the support level 101.58; the resistance level 103.16; the width of the pattern 158 points. If the resistance level is broken, a change in the trend can be predicted with the first target point lying at the distance of 161 points.