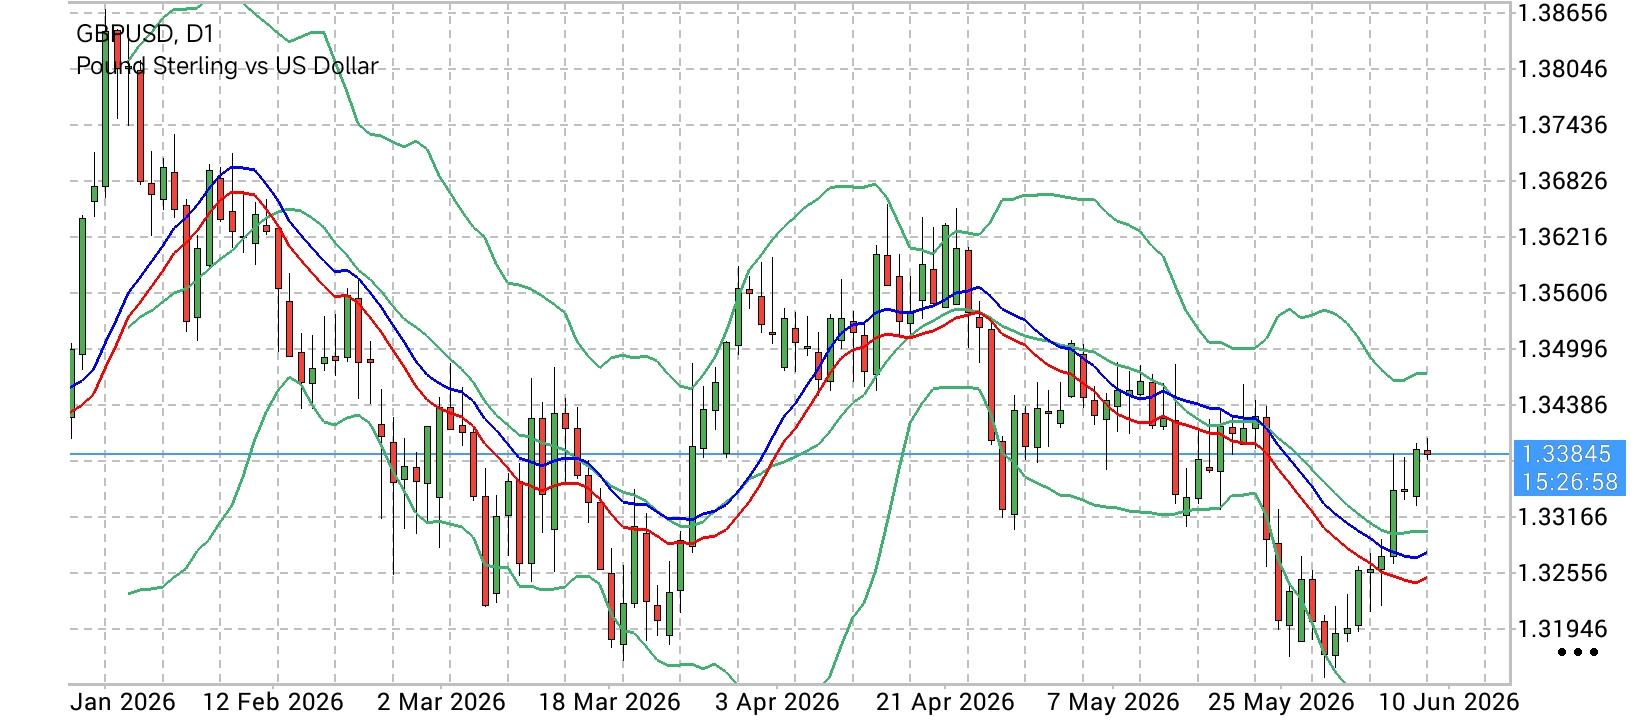
 The Sterling Ascent: GBP/USD Weaponizes Fed Easing Bets to Log Ninth Day of Gains Despite Hawkish Waller Backstop
 The
GBP/USD spot exchange rate maintained its aggressive, near-vertical trajectory during Tuesday's Asian trading window, chalking up a phenomenal ninth consecutive session of gains to press hard against the
1.3390 minor resistance threshold. This relentless rally reflects a fundamental macro regime shift, where broad-based distribution of the US Dollar—triggered by a systemic cooling of the American labor market and an unwinding of hawkish Federal Reserve rate expectations—completely overshadowed an increasingly cautious, less aggressive monetary policy runway for the Bank of England (
BoE). The Greenback's structural retreat accelerated after market participants sharply scaled back their terminal rate assumptions for the July and September Fed sessions. This dramatic shift in global capital flows followed a soft U.S. labor force report, which revealed that aggregate nonfarm payroll additions across April, May, and June significantly undershot Wall Street's consensus projections. Adding to this softer macro climate, a significant drop in crude oil benchmarks—catalyzed by an OPEC+ production boost and the high-profile U.S.-Iran peace framework that reopened the strategic Strait of Hormuz—has successfully drained energy-driven inflationary pressures out of the global economy, stripping the Fed of the fundamental urgency to enforce an aggressive policy path. While the Greenback attempted to find a baseline defensive cushion via resilient economic prints, like the June ISM Services PMI sticking firmly in expansionary territory at 54.0, and a hawkish media blitz from Fed Governor Christopher Waller (who scored a strong 7.1/10 on the FXS Speechtracker by reinforcing the sanctity of the 2% inflation target and pushing the FXS Fed Sentiment Index up to 125.72), the sheer force of buy-side momentum inside the Sterling order book kept the pair heavily insulated against corrective pullbacks. This structural outperformance is particularly striking given that domestic UK data has also turned more dovish; fixed-income desks have cut expectations for BoE tightening down to a mere 70% probability of a single 25-basis-point hike for the remainder of the year. Although BoE Governor Andrew Bailey acknowledged that inflation, currently at 2.8%, could temporarily spike above 3% by autumn due to delayed energy cost pass-throughs, the central bank's firm 7-2 vote to maintain the bank rate at 3.75% has kept major sell-side institutions focused on a prolonged pause, slating the next real tightening push out into late 2026.
Technical Trend Structure: Vertical Bullish Impulse Grinds Into Master Supply Channel On the daily (D1) chart, GBP/USD’s market geometry exhibits a blistering, parabolically extended trend structure. The nine-day winning streak has pushed shorter-term oscillators deep into premium overbought territory, meaning tactical flexibility is required as the cross charges into a highly historical multi-month liquidity pool.
The Dominant Bullish Regime: The intermediate technical structure is firmly controlled by buy-side algorithms, marked by an uncompromised sequence of higher daily closes that have completely detached price action from its longer-term moving averages. The overarching trend structure remains exceptionally constructive as long as the cross prints daily candle bodies above the
1.3280 support shelf.
Momentum and Volatility Profile: Due to the velocity of the current nine-day run, the 14-period Relative Strength Index (
RSI) has aggressively breached the
72.00 overbought threshold, printing its highest structural reading in months. Simultaneously, the price is tracking well above its trailing
9-day Exponential Moving Average (EMA) at 1.3280 and the
50-day EMA at 1.3140, warning traders that while the trend is strongly upward, it is technically mature and vulnerable to a sharp mean-reversion pullback if macroscopic data shifts.
The Critical Inflection Boundaries: To extend this bullish cycle toward multi-month macro targets, buyers must orchestrate a clean, high-volume breakout above the immediate resistance ceiling at
1.3420. Clearing this supply barrier opens an automated technical runway toward the unmitigated
1.3465 structural supply block, with the
1.3530 mathematical extension zone serving as the next major cluster. Conversely, if overbought exhaustion triggers a profit-taking event, immediate tactical support is anchored at
1.3325, followed closely by the core 9-day EMA defensive cushion at
1.3280. Only a decisive daily close below
1.3280 would neutralize the immediate upward impulse, opening a corrective markdown path down to the secular 50-day EMA anchor at
1.3140.
Strategic Trading Execution Grid: Position Orientation Actionable Entry Trigger Primary Target (TP) Protective Stop (SL) Technical Architecture & Rationale Trend-Continuation Long Daily Close >
1.3425 1.3495 / 1.3525 1.3360 Momentum breakout long executed on a confirmed close above the immediate swing high, trading the extension into macro targets.
Tactical Retracement Short Limit Order Entry @
1.3415 1.3330 / 1.3290 1.3455 High-risk counter-trend short scaling into the overbought RSI extension, trading a mean-reversion drop to the trailing 9-day EMA.
*The market analysis posted here is meant to increase your awareness, but not to give instructions to make a trade
 Italiano
 Русский
 English
 Bahasa Indonesia
 Bahasa Malay
 ไทย
ไทย Español
 Deutsch
 Български
 Français
 Tiếng Việt
 中文
中文 বাংলা
বাংলা हिन्दी
 Čeština
 Українська
 Română
