 Română
  Русский
 English
 Bahasa Indonesia
 Bahasa Malay
 ไทย
ไทย Español
 Deutsch
 Български
 Français
 Tiếng Việt
 中文
中文 বাংলা
বাংলা हिन्दी
 Čeština
 Українська
 The Bullish pennant pattern is formed on the #MA M5 chart. It is a type of the continuation pattern. Supposedly, in case the price is fixed above the pennant’s high of 580.09, a further uptrend is possible.
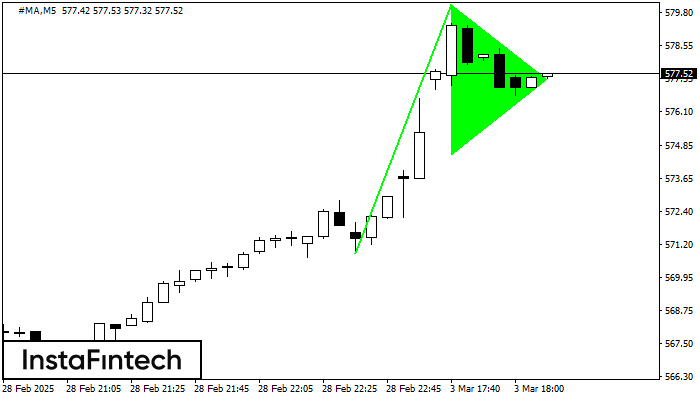
 The M5 and M15 time frames may have more false entry points.