 Română
 Русский
 English
 Bahasa Indonesia
 Bahasa Malay
 ไทย
ไทย Español
 Deutsch
 Български
 Français
 Tiếng Việt
 中文
中文 বাংলা
বাংলা हिन्दी
 Čeština
 Українська
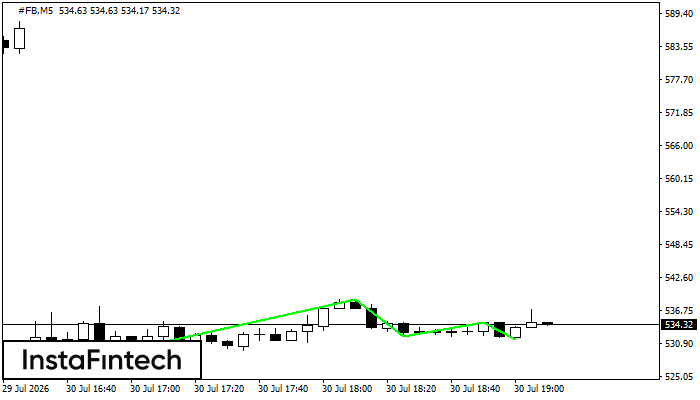 The Triple Bottom pattern has formed on the #FB M5 chart. A break above the confirmation resistance at 538.75 may signal a reversal from a downtrend to an uptrend.
 The M5 and M15 time frames may generate more false entry signals.
 The Triple Bottom pattern has formed on the #FB M5 chart. A break above the confirmation resistance at 538.75 may signal a reversal from a downtrend to an uptrend.