 Română
 Русский
 English
 Bahasa Indonesia
 Bahasa Malay
 ไทย
ไทย Español
 Deutsch
 Български
 Français
 Tiếng Việt
 中文
中文 বাংলা
বাংলা हिन्दी
 Čeština
 Українська

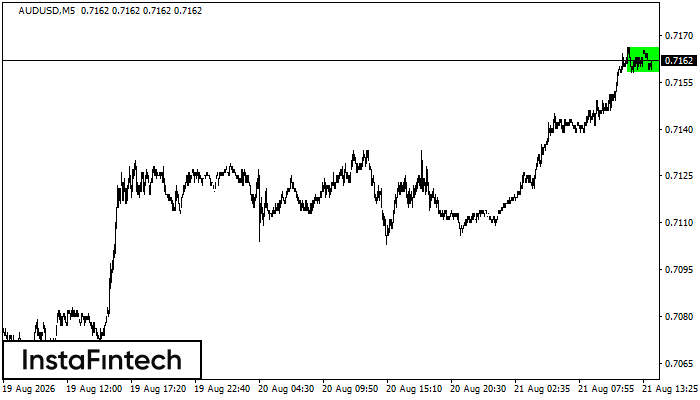 The Bullish Rectangle has formed on the AUDUSD M5 chart. This is a trend continuation pattern bounded by the lower boundary at 0.7158–0.7158 and the upper boundary at 0.7166–0.7166. A breakout above the upper boundary is likely to signal a continuation of the uptrend.
 The M5 and M15 time frames may generate more false entry signals.