 Română

 Русский
 English
 Bahasa Indonesia
 Bahasa Malay
 ไทย
 Español
 Deutsch
 Български
 Français
 Tiếng Việt
 中文
 বাংলা
 हिन्दी
 Čeština
 Українська


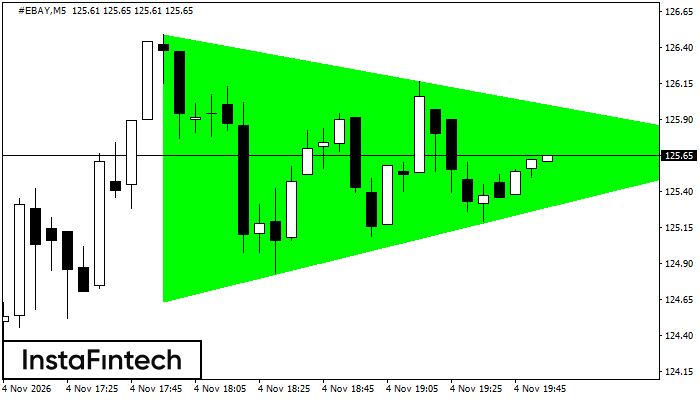 The Bullish Symmetrical Triangle pattern has formed on the #EBAY M5 chart. Its lower boundary passes through 124.64/125.70, while its upper boundary passes through 126.49/125.70. The Bullish Symmetrical Triangle is a continuation pattern and therefore supports a further rise. If confirmed, #EBAY is expected to break the upper boundary and move toward 125.85.
The M5 and M15 time frames may generate more false entry signals.