 Română
  Русский
 English
 Bahasa Indonesia
 Bahasa Malay
 ไทย
ไทย Español
 Deutsch
 Български
 Français
 Tiếng Việt
 中文
中文 বাংলা
বাংলা हिन्दी
 Čeština
 Українська
FX.co ★ Actual patterns. Technical analysis and trading recommendations

Technical Analysis Patterns
There is nothing more precious to a trader than an ability to predict a further price movement. Technical analysis is a key to your successful transaction. At the same time, you can rely on common and recurring situations that arise in the same circumstances. Our Technical Analysis Patterns section features all trading recommendations based on the technical analysis patterns that help traders make projections and turn a profit.
Instrument:
1 selected
#Bitcoin
EURCHF
EURGBP
EURJPY
EURUSD
EURCAD
EURRUB
EURNZD
USDCAD
USDCHF
USDJPY
USDRUB
NZDCAD
NZDUSD
NZDCHF
NZDJPY
AUDCAD
AUDCHF
AUDJPY
AUDUSD
GBPUSD
GBPJPY
GBPAUD
GBPCHF
GOLD
SILVER
#AAPL
#AMZN
#EBAY
#FB
#GOOG
#MCD
#MA
#KO
#INTC
#MSFT
#NTDOY
#PEP
#TSLA
#TWTR
Figure:
All
Triangle
Rectangle
Pennant
Flag
Head and Shoulders
Double Top
Triple top
Timeframe:
All
M5
M15
M30
H1
D1
Signal strength:
All
High
Medium
Low
Signal direction:
All
Buy
Sell
EURUSD
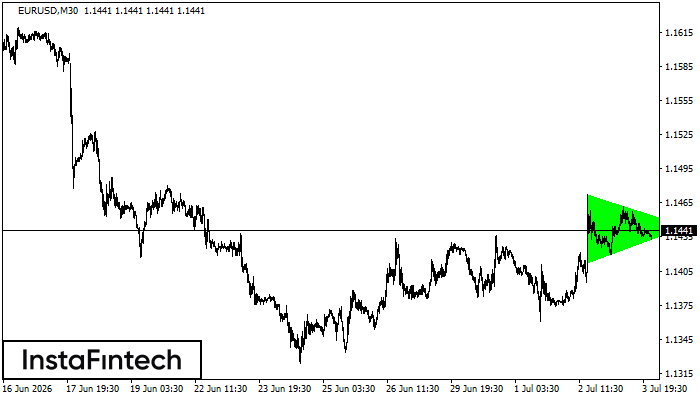
EURUSD M30
Bullish Symmetrical Triangle
According to the chart of M30, EURUSD formed the Bullish Symmetrical Triangle pattern. Description: This is the pattern of a trend continuation. 1.1472 and 1.1413 are the coordinates of the upper and lower borders respectively. The pattern width is measured on the chart at 59 pips. Outlook: If the upper border 1.1472 is broken, the price is likely to continue its move by 1.1474.
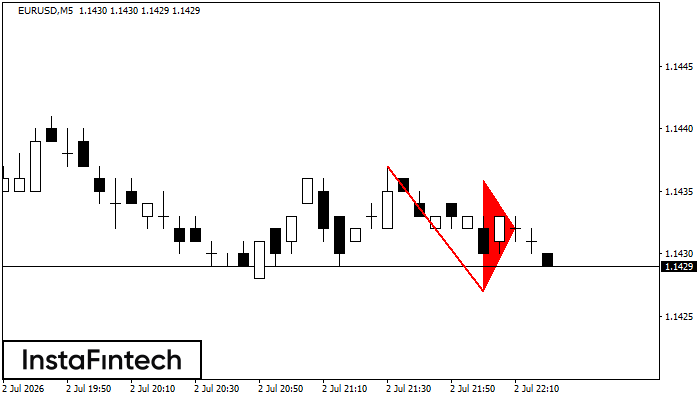
EURUSD M5
Bearish pennant
The Bearish pennant pattern has formed on the EURUSD M5 chart. This pattern type is characterized by a slight slowdown after which the price will move in the direction of the original trend. In case the price fixes below the pattern’s low of 1.1427, a trader will be able to successfully enter the sell position.
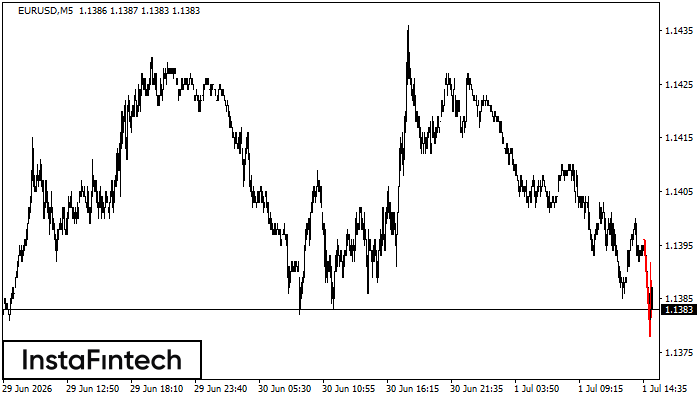
EURUSD M5
Bearish Flag
The Bearish Flag pattern has been formed on EURUSD at M5. The lower boundary of the pattern is located at 1.1378/1.1388 while the upper boundary lies at 1.1386/1.1396. The projection of the flagpole is 18 points. This formation signals that the downward trend is most likely to continue. Therefore, if the level of 1.1378 is broken, the price will move further downwards.
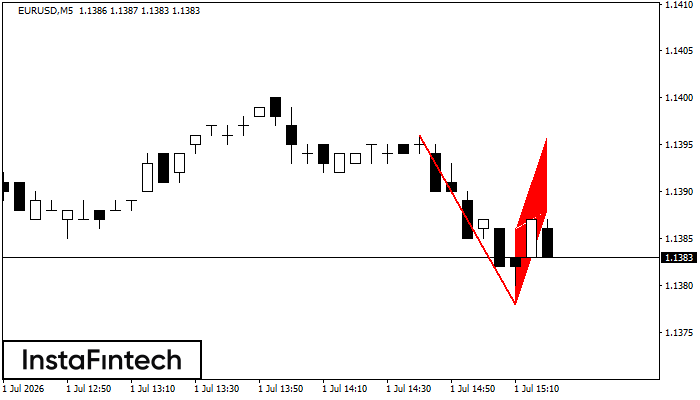
EURUSD M5
Bearish pennant
The Bearish pennant pattern has formed on the EURUSD M5 chart. The pattern signals continuation of the downtrend in case the pennant’s low of 1.1378 is broken through. Recommendations: Place the sell stop pending order 10 pips below the pattern’s low. Place the take profit order at the projection distance of the flagpole height.
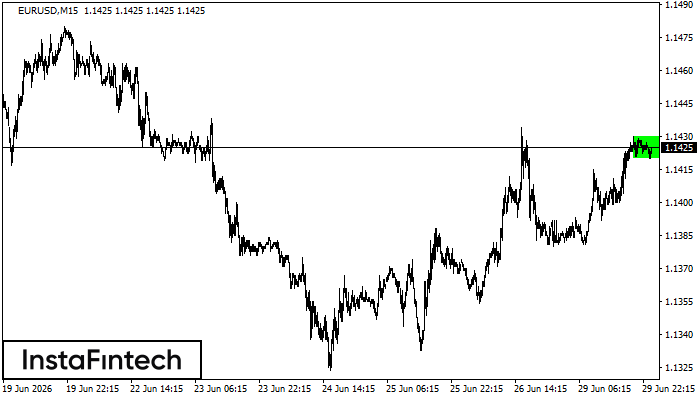
EURUSD M15
Bullish Rectangle
According to the chart of M15, EURUSD formed the Bullish Rectangle. This type of a pattern indicates a trend continuation. It consists of two levels: resistance 1.1430 and support 1.1420. In case the resistance level 1.1430 - 1.1430 is broken, the instrument is likely to follow the bullish trend.
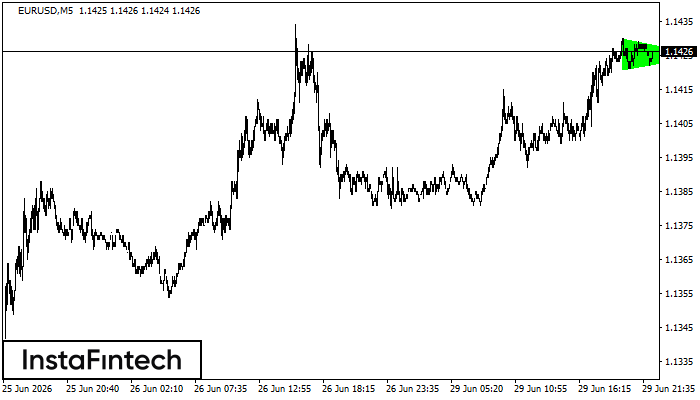
EURUSD M5
Bullish Symmetrical Triangle
According to the chart of M5, EURUSD formed the Bullish Symmetrical Triangle pattern. Description: This is the pattern of a trend continuation. 1.1430 and 1.1421 are the coordinates of the upper and lower borders respectively. The pattern width is measured on the chart at 9 pips. Outlook: If the upper border 1.1430 is broken, the price is likely to continue its move by 1.1440.
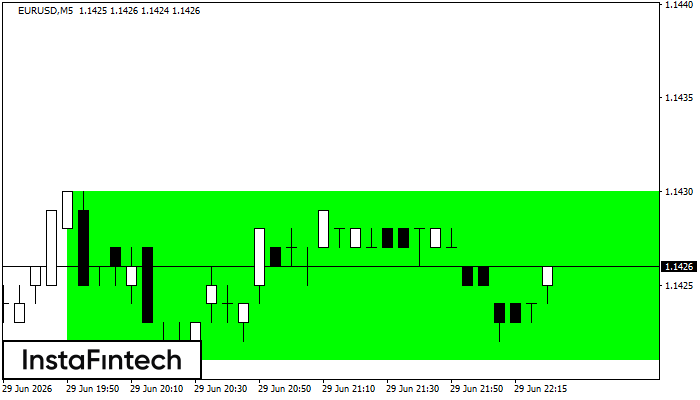
EURUSD M5
Bullish Rectangle
According to the chart of M5, EURUSD formed the Bullish Rectangle which is a pattern of a trend continuation. The pattern is contained within the following borders: the lower border 1.1421 – 1.1421 and upper border 1.1430 – 1.1430. In case the upper border is broken, the instrument is likely to follow the upward trend.
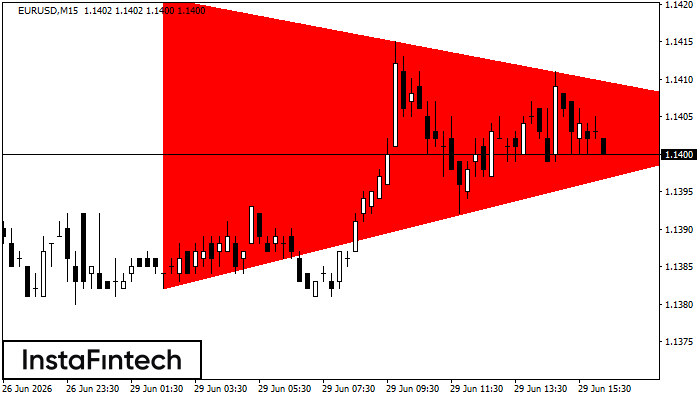
EURUSD M15
Bearish Symmetrical Triangle
According to the chart of M15, EURUSD formed the Bearish Symmetrical Triangle pattern. Description: The lower border is 1.1382/1.1404 and upper border is 1.1421/1.1404. The pattern width is measured on the chart at -39 pips. The formation of the Bearish Symmetrical Triangle pattern evidently signals a continuation of the downward trend. In other words, if the scenario comes true and EURUSD breaches the lower border, the price could continue its move toward 1.1381.
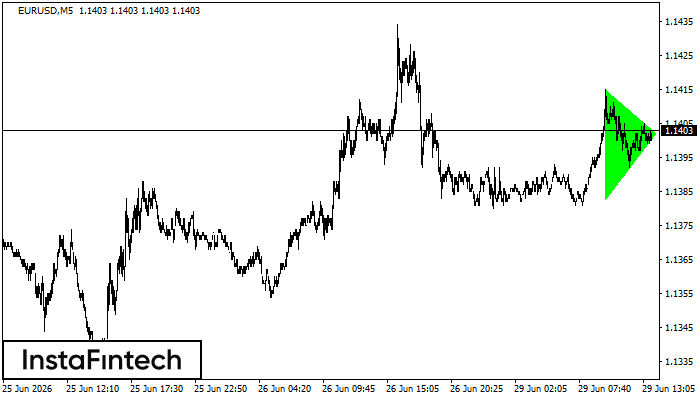
EURUSD M5
Bullish Symmetrical Triangle
According to the chart of M5, EURUSD formed the Bullish Symmetrical Triangle pattern, which signals the trend will continue. Description. The upper border of the pattern touches the coordinates 1.1415/1.1402 whereas the lower border goes across 1.1383/1.1402. The pattern width is measured on the chart at 32 pips. If the Bullish Symmetrical Triangle pattern is in progress during the upward trend, this indicates the current trend will go on. In case 1.1402 is broken, the price could continue its move toward 1.1417.
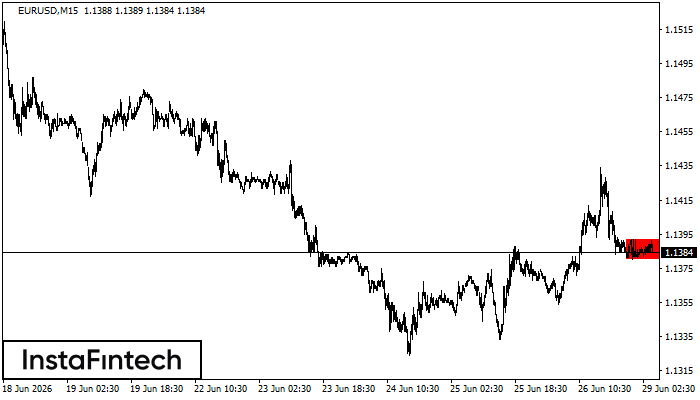
EURUSD M15
Bearish Rectangle
According to the chart of M15, EURUSD formed the Bearish Rectangle. This type of a pattern indicates a trend continuation. It consists of two levels: resistance 1.1392 - 0.0000 and support 1.1380 – 1.1380. In case the resistance level 1.1380 - 1.1380 is broken, the instrument is likely to follow the bearish trend.