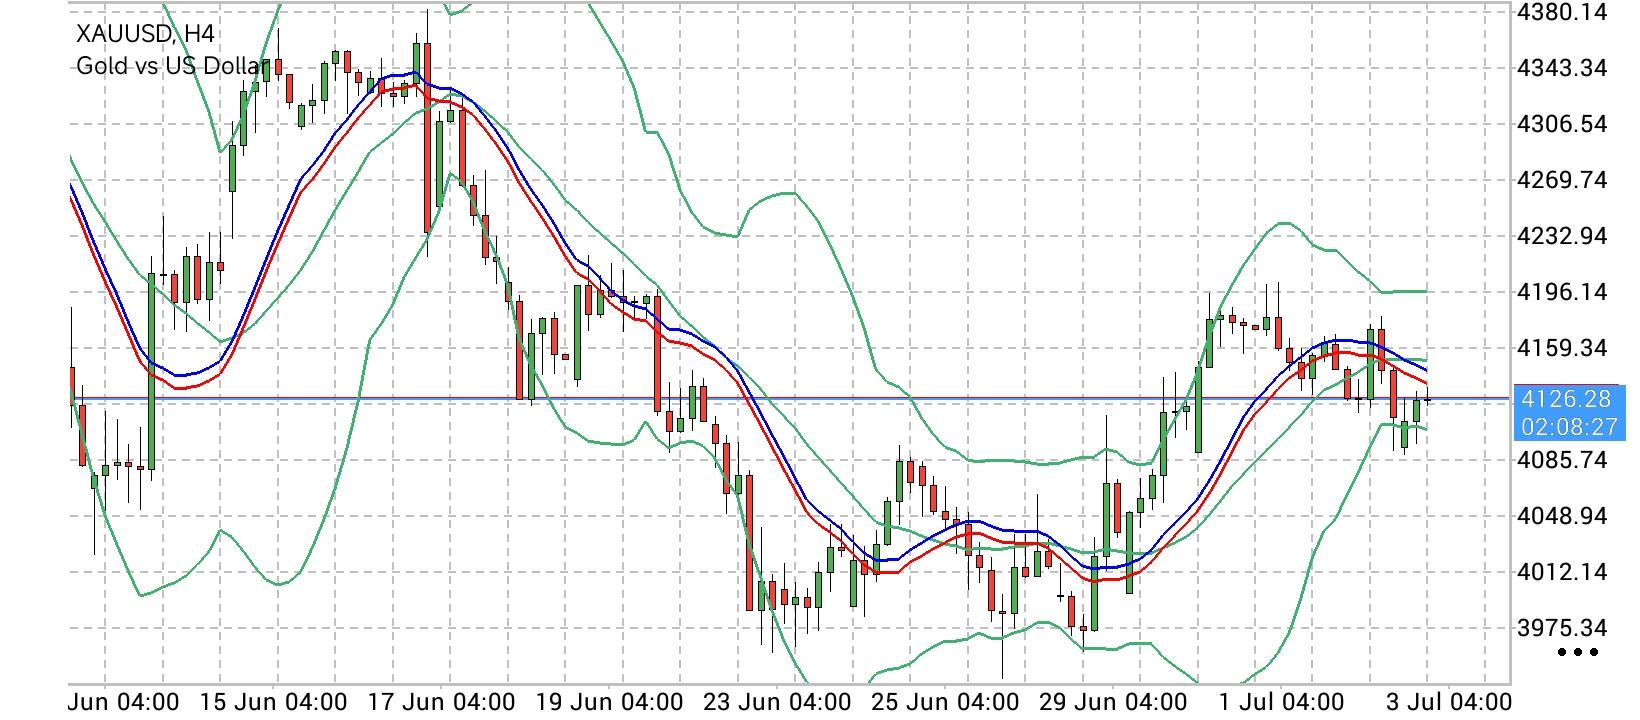
 The Geopolitical Furnace: Gold Defends $4,100 Threshold as Re-Ignited Inflation Fears and Rising Yields Bolster the Dollar
 Spot Gold (
XAU/USD) managed to anchor its feet during Wednesday's Asian trading session, clinging onto modest intraday gains slightly above the psychological
$4,100 line. This minor uptick effectively paused a punishing two-day losing streak, rescuing the metal from a weekly trough hammered out during the prior session. While bullion found a localized pocket of demand due to the US Dollar bulls pausing ahead of the highly anticipated June FOMC Meeting Minutes, the broader fundamental tape suggests this bounce is a fragile counter-trend reaction rather than a full structural reversal. The metal remains deeply vulnerable after washing out from its recent two-week high above
$4,200 recorded on Monday, as a toxic combination of energy-driven inflation fears and soaring global bond yields limits the non-yielding asset's upside. The foundational shift in macro sentiment stems from a dangerous escalation in the Middle East. Following reported attacks on three commercial oil tankers traversing the strategic Strait of Hormuz, the US military launched an aggressive wave of retailatory strikes against Iranian targets on Tuesday, putting an already unstable regional ceasefire in severe jeopardy. This flare-up instantly injected a heavy geopolitical risk premium back into global markets, driving institutional flow right into the safety of the Greenback's reserve status. Compounding the issue, Washington abruptly canceled a vital diplomatic concession that had permitted Iran to sell crude on open international markets. This policy shift sparked a major supply-shock rally in Crude Oil prices on Tuesday, instantly reviving global energy-driven inflation anxieties. Rather than working as a classic safe-haven driver for gold, these heightened inflation expectations have instead solidified the Federal Reserve's hawkish "higher-for-longer" narrative. According to the CME Group's FedWatch Tool, fixed-income desks are now pricing in a commanding
80% plus probability that the US central bank will enact at least one more 25-basis-point interest rate hike before the year concludes. Anticipation of a stern, restrictive tone within tonight’s FOMC minutes has sent US sovereign debt yields marching higher. The benchmark US 10-year Treasury yield surged up to
4.567%, while the highly policy-sensitive 2-year note climbed to
4.189%. This rapid repricing heavily penalizes physical bullion, which carries an escalating opportunity cost in an environment of climbing risk-free yields, signaling extreme macro caution before executing structural buy-side exposure.
Technical Trend Structure: Descending Channel Dominates Long-Term Horizon From a pure chart geometry perspective, the daily (D1) trend structure for XAU/USD remains firmly locked inside a textbook macro downward-sloping channel. Despite a minor recovery attempt off the recent weekly base, the technical architecture remains heavily skewed in favor of sell-side market makers until a major structural shift occurs.
The Bearish Channel Regime: The daily chart illustrates that Gold is confined within a beautifully defined bearish channel, trading below its long-term
200-day Simple Moving Average (SMA) located at $4,491.30. This macro orientation tells us that the dominant institutional order flow is still targeted downward, treating short-term spikes as exit liquidity opportunities.
Indicator Configuration and Divergence: The internal technical metrics highlight a market undergoing complex rotational friction. The Moving Average Convergence Divergence (
MACD) histogram has managed to tick marginally into positive territory, validating the current localized short-term recovery effort. However, the 14-period Relative Strength Index (
RSI) is pinned down at
44.33—comfortably below its neutral 50 midline. This lack of confirmation indicates that underlying momentum remains defensive and lacks the structural buy-side aggression needed to break the channel.
The Strategic Inflection Boundaries: For the bulls to meaningfully reverse this bearish structural bias, they must engineer a clean daily breakout above the immediate overhead channel supply wall resting at
$4,164.35. A success there would set up a multi-week recovery path toward the intermediate
$4,300.00 horizontal pivot, though the ultimate line in the sand remains the 200-day SMA at
$4,491.30. On the downside, if the current bounce prints a lower high below the upper channel wall, sellers will target the weekly session lows around
$4,080.00. A break below that minor support layer re-opens a markdown path down through
$3,950.00, ultimately targeting the structural lower boundary of the channel mapped down at
$3,713.85.
Strategic Trading Execution Grid: Position Orientation Actionable Entry Trigger Primary Target (TP) Protective Stop (SL) Technical Architecture & Rationale Trend-Continuation Short Limit Order Entry @
$4,155.00 $4,085.00 / $3,960.00 $4,182.00 Fade entry positioned immediately below the descending channel upper roof, trading the dominant high-timeframe trend downward.
Tactical Breakout Long Daily Close >
$4,175.00 $4,290.00 / $4,350.00 $4,120.00 Breakout trade triggered on a verified daily candle close above the channel ceiling, capturing a short-squeeze up to unmitigated macro pivots.
*The market analysis posted here is meant to increase your awareness, but not to give instructions to make a trade
 Română
 Русский
 English
 Bahasa Indonesia
 Bahasa Malay
 ไทย
ไทย Español
 Deutsch
 Български
 Français
 Tiếng Việt
 中文
中文 বাংলা
বাংলা हिन्दी
 Čeština
 Українська
