 中文
中文  Русский
 English
 Bahasa Indonesia
 Bahasa Malay
 ไทย
ไทย Español
 Deutsch
 Български
 Français
 Tiếng Việt
 বাংলা
বাংলা हिन्दी
 Čeština
 Українська
 Română
 According to the chart of M5, GOLD formed the Bullish Rectangle. This type of a pattern indicates a trend continuation. It consists of two levels: resistance 3396.64 and support 3390.42. In case the resistance level 3396.64 - 3396.64 is broken, the instrument is likely to follow the bullish trend.
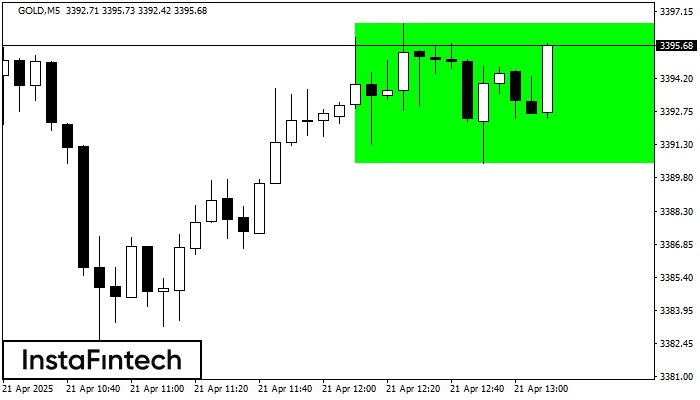
 The M5 and M15 time frames may have more false entry points.