 中文
中文  Русский
 English
 Bahasa Indonesia
 Bahasa Malay
 ไทย
ไทย Español
 Deutsch
 Български
 Français
 Tiếng Việt
 বাংলা
বাংলা हिन्दी
 Čeština
 Українська
 Română
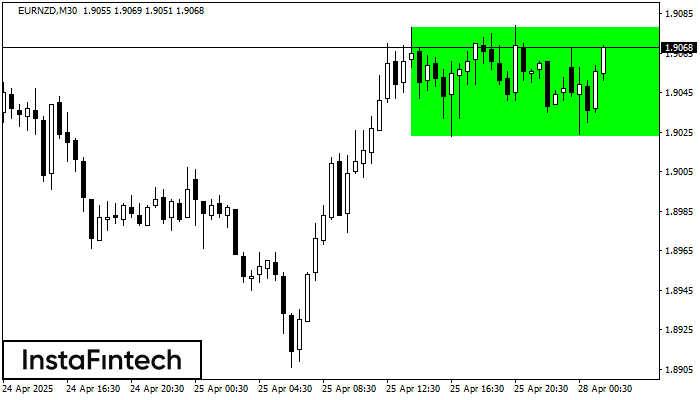 According to the chart of M30, EURNZD formed the Bullish Rectangle which is a pattern of a trend continuation. The pattern is contained within the following borders: the lower border 1.9023 – 1.9023 and upper border 1.9078 – 1.9078. In case the upper border is broken, the instrument is likely to follow the upward trend.
 FX.co ★ EURNZD M30: Bullish Rectangle
Signal strength 3 of 5
EURNZD M30: Bullish Rectangle
According to the chart of M30, EURNZD formed the Bullish Rectangle which is a pattern of a trend continuation. The pattern is contained within the following borders: the lower border 1.9023 – 1.9023 and upper border 1.9078 – 1.9078. In case the upper border is broken, the instrument is likely to follow the upward trend. *此处发布的市场分析旨在提高您的意识,但不提供交易指示