 中文
中文  Русский
 English
 Bahasa Indonesia
 Bahasa Malay
 ไทย
ไทย Español
 Deutsch
 Български
 Français
 Tiếng Việt
 বাংলা
বাংলা हिन्दी
 Čeština
 Українська
 Română
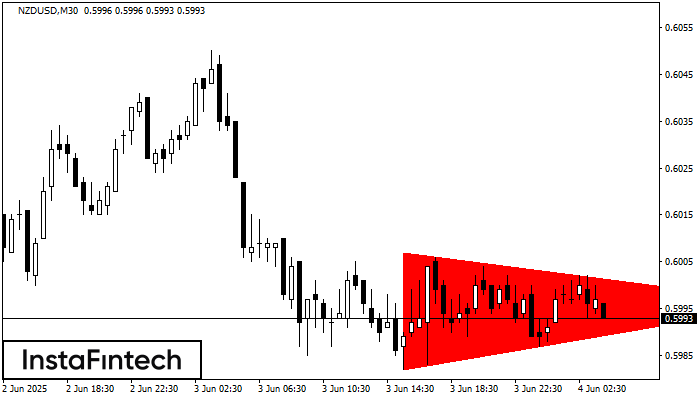 According to the chart of M30, NZDUSD formed the Bearish Symmetrical Triangle pattern. Description: The lower border is 0.5982/0.5996 and upper border is 0.6007/0.5996. The pattern width is measured on the chart at -25 pips. The formation of the Bearish Symmetrical Triangle pattern evidently signals a continuation of the downward trend. In other words, if the scenario comes true and NZDUSD breaches the lower border, the price could continue its move toward 0.5966.
 FX.co ★ NZDUSD M30: Bearish Symmetrical Triangle
Signal strength 3 of 5
NZDUSD M30: Bearish Symmetrical Triangle
According to the chart of M30, NZDUSD formed the Bearish Symmetrical Triangle pattern. Description: The lower border is 0.5982/0.5996 and upper border is 0.6007/0.5996. The pattern width is measured on the chart at -25 pips. The formation of the Bearish Symmetrical Triangle pattern evidently signals a continuation of the downward trend. In other words, if the scenario comes true and NZDUSD breaches the lower border, the price could continue its move toward 0.5966. *此处发布的市场分析旨在提高您的意识,但不提供交易指示