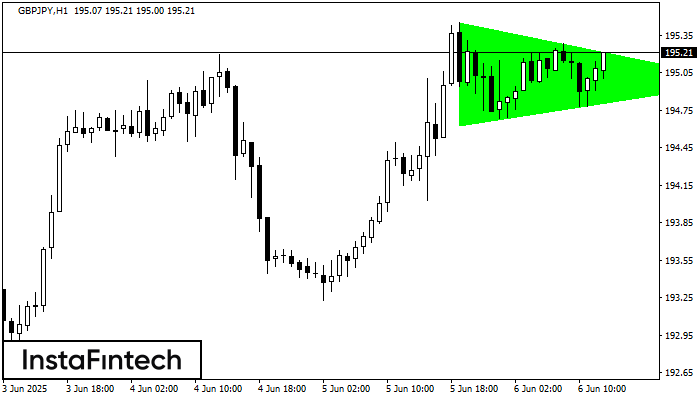
 According to the chart of H1, GBPJPY formed the Bullish Symmetrical Triangle pattern. The lower border of the pattern touches the coordinates 194.63/194.98 whereas the upper border goes across 195.45/194.98. If the Bullish Symmetrical Triangle pattern is in progress, this evidently signals a further upward trend. In other words, in case the scenario comes true, the price of GBPJPY will breach the upper border to head for 195.38.
 FX.co ★ GBPJPY H1: Bullish Symmetrical Triangle
Signal strength 4 of 5
GBPJPY H1: Bullish Symmetrical Triangle
 According to the chart of H1, GBPJPY formed the Bullish Symmetrical Triangle pattern. The lower border of the pattern touches the coordinates 194.63/194.98 whereas the upper border goes across 195.45/194.98. If the Bullish Symmetrical Triangle pattern is in progress, this evidently signals a further upward trend. In other words, in case the scenario comes true, the price of GBPJPY will breach the upper border to head for 195.38.
 *此处发布的市场分析旨在提高您的意识,但不提供交易指示
 中文
中文 
 Русский
 English
 Bahasa Indonesia
 Bahasa Malay
 ไทย
ไทย Español
 Deutsch
 Български
 Français
 Tiếng Việt
 বাংলা
বাংলা हिन्दी
 Čeština
 Українська
 Română
