 中文
中文  Русский
 English
 Bahasa Indonesia
 Bahasa Malay
 ไทย
ไทย Español
 Deutsch
 Български
 Français
 Tiếng Việt
 বাংলা
বাংলা हिन्दी
 Čeština
 Українська
 Română
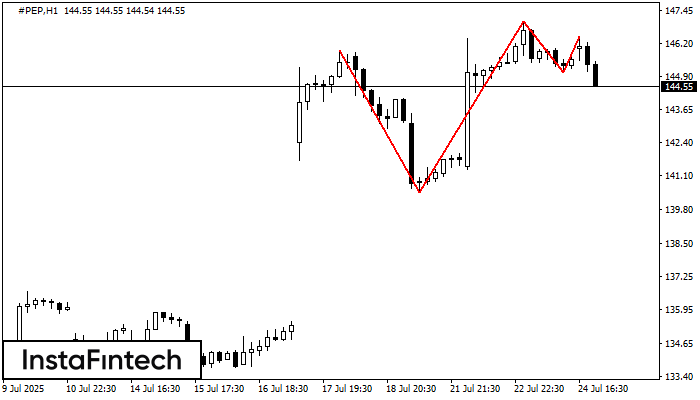 The Triple Top pattern has formed on the chart of the #PEP H1. Features of the pattern: borders have an ascending angle; the lower line of the pattern has the coordinates 140.45/145.07 with the upper limit 145.93/146.45; the projection of the width is 548 points. The formation of the Triple Top figure most likely indicates a change in the trend from upward to downward. This means that in the event of a breakdown of the support level of 140.45, the price is most likely to continue the downward movement.
 FX.co ★ #PEP H1: Triple Top
Signal strength 4 of 5
#PEP H1: Triple Top
The Triple Top pattern has formed on the chart of the #PEP H1. Features of the pattern: borders have an ascending angle; the lower line of the pattern has the coordinates 140.45/145.07 with the upper limit 145.93/146.45; the projection of the width is 548 points. The formation of the Triple Top figure most likely indicates a change in the trend from upward to downward. This means that in the event of a breakdown of the support level of 140.45, the price is most likely to continue the downward movement. *此处发布的市场分析旨在提高您的意识,但不提供交易指示