 中文
中文  Русский
 English
 Bahasa Indonesia
 Bahasa Malay
 ไทย
ไทย Español
 Deutsch
 Български
 Français
 Tiếng Việt
 বাংলা
বাংলা हिन्दी
 Čeština
 Українська
 Română
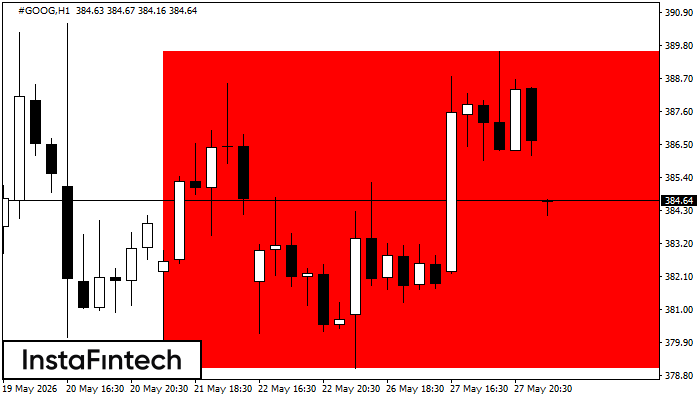 According to the chart of H1, #GOOG formed the Bearish Rectangle. This type of a pattern indicates a trend continuation. It consists of two levels: resistance 389.61 - 0.00 and support 379.05 – 379.05. In case the resistance level 379.05 - 379.05 is broken, the instrument is likely to follow the bearish trend.
 FX.co ★ #GOOG H1: Bearish Rectangle
Signal strength 4 of 5
#GOOG H1: Bearish Rectangle
According to the chart of H1, #GOOG formed the Bearish Rectangle. This type of a pattern indicates a trend continuation. It consists of two levels: resistance 389.61 - 0.00 and support 379.05 – 379.05. In case the resistance level 379.05 - 379.05 is broken, the instrument is likely to follow the bearish trend. *此处发布的市场分析旨在提高您的意识,但不提供交易指示