FX.co ★ #Bitcoin M5: 看跌矩形 技术分析模式 2026-09-29T16:42:17Signal strength 1 of 5 #Bitcoin M5: 看跌矩形 #Bitcoin在M5图表上形成了“看跌矩形”形态,表明趋势可能延续。上边界为83321.92,下边界为82909.67。价格确认跌破“看跌矩形”的82909.67下边界后,可考虑做空。 M5和M15周期可能出现更多虚假入场信号。*此处发布的市场分析旨在提高您的意识,但不提供交易指示 Go to the patterns list Go to graph
 中文
中文 
 Русский
 English
 Bahasa Indonesia
 Bahasa Malay
 ไทย
ไทย Español
 Deutsch
 Български
 Français
 Tiếng Việt
 বাংলা
বাংলা हिन्दी
 Čeština
 Українська
 Română
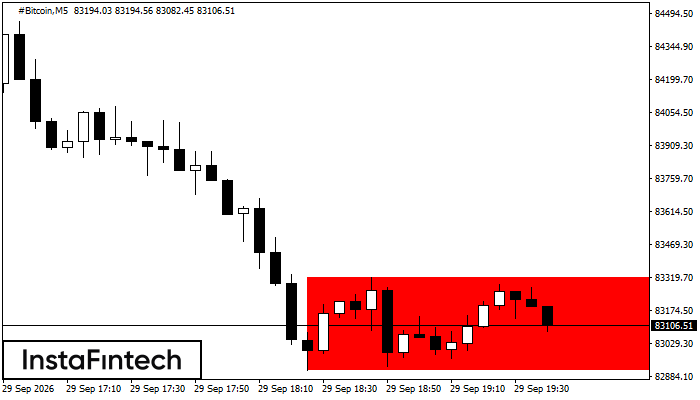 #Bitcoin在M5图表上形成了“看跌矩形”形态,表明趋势可能延续。上边界为83321.92,下边界为82909.67。价格确认跌破“看跌矩形”的82909.67下边界后,可考虑做空。
  #Bitcoin在M5图表上形成了“看跌矩形”形态,表明趋势可能延续。上边界为83321.92,下边界为82909.67。价格确认跌破“看跌矩形”的82909.67下边界后,可考虑做空。