 中文
中文  Русский
 English
 Bahasa Indonesia
 Bahasa Malay
 ไทย
ไทย Español
 Deutsch
 Български
 Français
 Tiếng Việt
 বাংলা
বাংলা हिन्दी
 Čeština
 Українська
 Română
FX.co ★ Actual patterns. Technical analysis and trading recommendations

技术分析模式
There is nothing more precious to a trader than an ability to predict a further price movement. Technical analysis is a key to your successful transaction. At the same time, you can rely on common and recurring situations that arise in the same circumstances. Our Technical Analysis Patterns section features all trading recommendations based on the technical analysis patterns that help traders make projections and turn a profit.
Instrument:
1 selected
#Bitcoin
EURCHF
EURGBP
EURJPY
EURUSD
EURCAD
EURRUB
EURNZD
USDCAD
USDCHF
USDJPY
USDRUB
NZDCAD
NZDUSD
NZDCHF
NZDJPY
AUDCAD
AUDCHF
AUDJPY
AUDUSD
GBPUSD
GBPJPY
GBPAUD
GBPCHF
GOLD
SILVER
#AAPL
#AMZN
#EBAY
#FB
#GOOG
#MCD
#MA
#KO
#INTC
#MSFT
#NTDOY
#PEP
#TSLA
#TWTR
Figure:
所有
Triangle
Rectangle
Pennant
Flag
Head and Shoulders
Double Top
Triple top
Timeframe:
所有
M5
M15
M30
H1
D1
Signal strength:
所有
High
Medium
Low
Signal direction:
所有
Buy
Sell
GBPAUD
GBPAUD M5
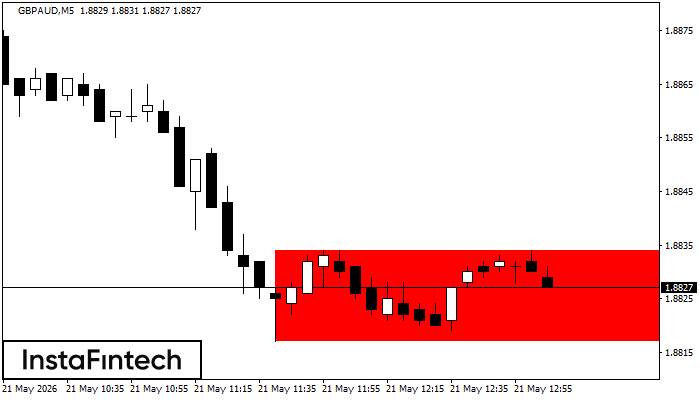
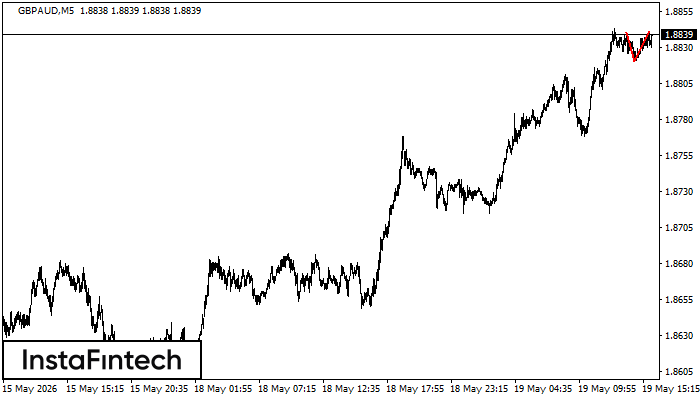
Bearish Rectangle
According to the chart of M5, GBPAUD formed the Bearish Rectangle. The pattern indicates a trend continuation. The upper border is 1.8834, the lower border is 1.8817. The signal means that a short position should be opened after fixing a price below the lower border 1.8817 of the Bearish Rectangle.
GBPAUD M5
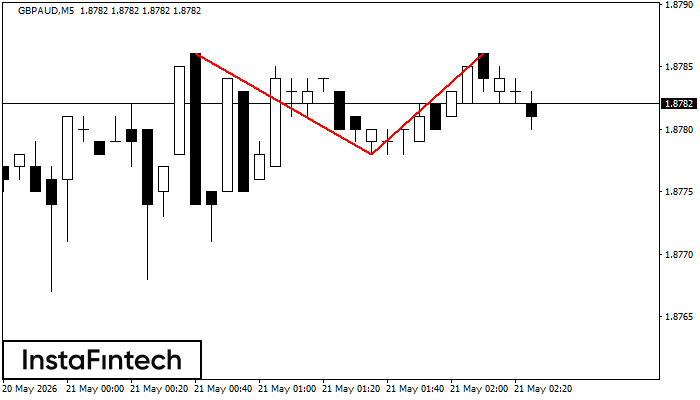
Double Top
On the chart of GBPAUD M5 the Double Top reversal pattern has been formed. Characteristics: the upper boundary 1.8786; the lower boundary 1.8778; the width of the pattern 8 points. The signal: a break of the lower boundary will cause continuation of the downward trend targeting the 1.8763 level.
GBPAUD M5
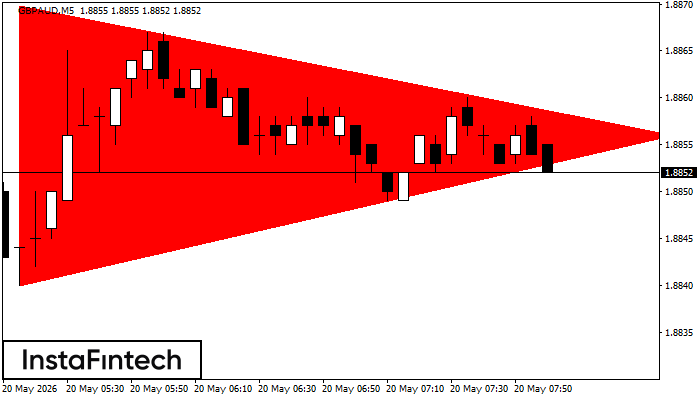
Bearish Symmetrical Triangle
According to the chart of M5, GBPAUD formed the Bearish Symmetrical Triangle pattern. Description: The lower border is 1.8840/1.8856 and upper border is 1.8870/1.8856. The pattern width is measured on the chart at -30 pips. The formation of the Bearish Symmetrical Triangle pattern evidently signals a continuation of the downward trend. In other words, if the scenario comes true and GBPAUD breaches the lower border, the price could continue its move toward 1.8841.
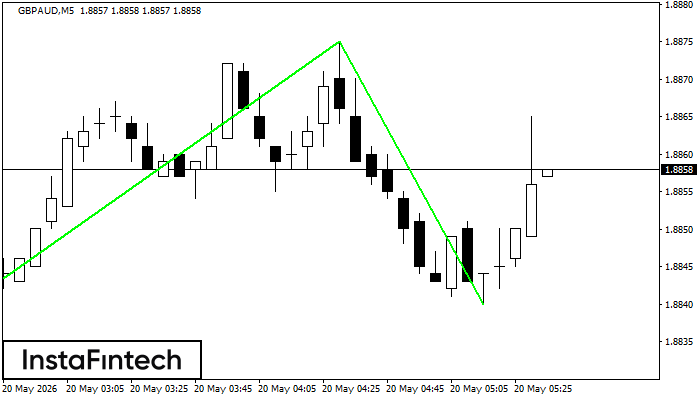
GBPAUD M5
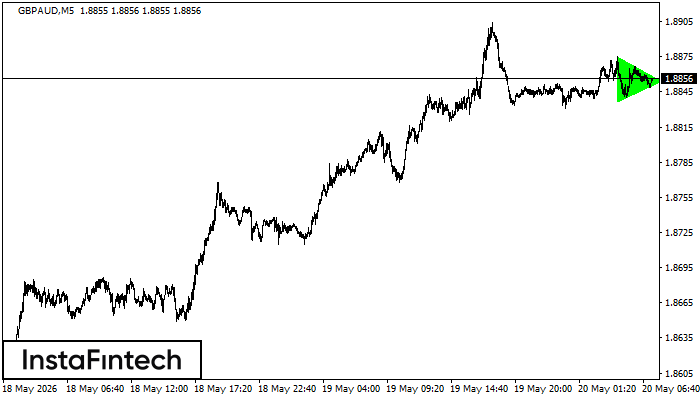
Bullish Symmetrical Triangle
According to the chart of M5, GBPAUD formed the Bullish Symmetrical Triangle pattern. The lower border of the pattern touches the coordinates 1.8836/1.8854 whereas the upper border goes across 1.8875/1.8854. If the Bullish Symmetrical Triangle pattern is in progress, this evidently signals a further upward trend. In other words, in case the scenario comes true, the price of GBPAUD will breach the upper border to head for 1.8869.
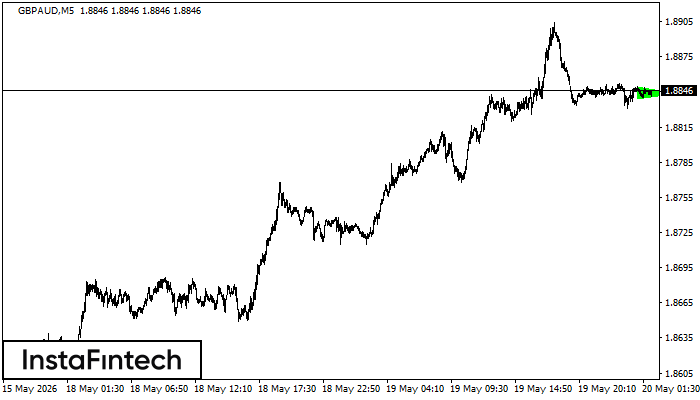
GBPAUD M5
Double Bottom
The Double Bottom pattern has been formed on GBPAUD M5. This formation signals a reversal of the trend from downwards to upwards. The signal is that a buy trade should be opened after the upper boundary of the pattern 1.8875 is broken. The further movements will rely on the width of the current pattern 36 points.
GBPAUD M5
Bullish Symmetrical Triangle
According to the chart of M5, GBPAUD formed the Bullish Symmetrical Triangle pattern. Description: This is the pattern of a trend continuation. 1.8850 and 1.8839 are the coordinates of the upper and lower borders respectively. The pattern width is measured on the chart at 11 pips. Outlook: If the upper border 1.8850 is broken, the price is likely to continue its move by 1.8859.
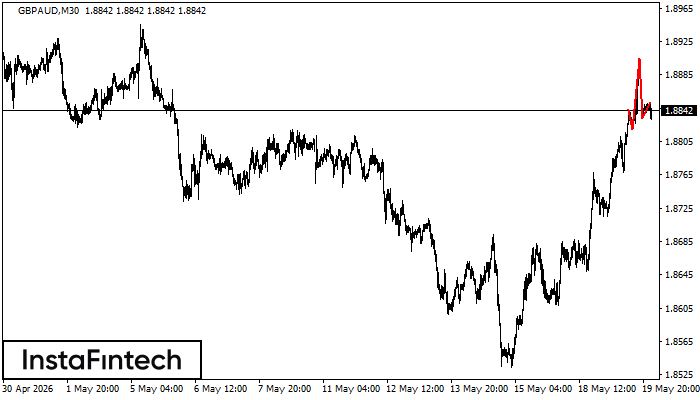
GBPAUD M30
Head and Shoulders
The GBPAUD M30 formed the Head and Shoulders pattern with the following features: The Head’s top is at 1.8904, the Neckline and the upward angle are at 1.8820/1.8833. The formation of this pattern can bring about changes in the current trend from bullish to bearish. In case the pattern triggers the expected changes, the price of GBPAUD will go towards 1.8803.
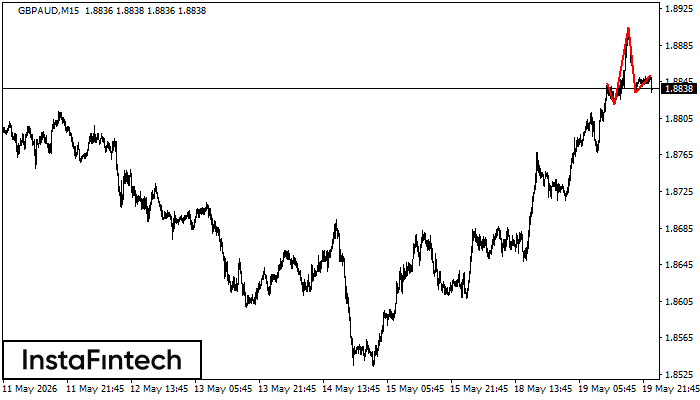
GBPAUD M15
Head and Shoulders
The GBPAUD M15 formed the Head and Shoulders pattern with the following features: The Head’s top is at 1.8904, the Neckline and the upward angle are at 1.8820/1.8833. The formation of this pattern can bring about changes in the current trend from bullish to bearish. In case the pattern triggers the expected changes, the price of GBPAUD will go towards 1.8810.
GBPAUD M5
Double Top
The Double Top pattern has been formed on GBPAUD M5. It signals that the trend has been changed from upwards to downwards. Probably, if the base of the pattern 1.8820 is broken, the downward movement will continue.
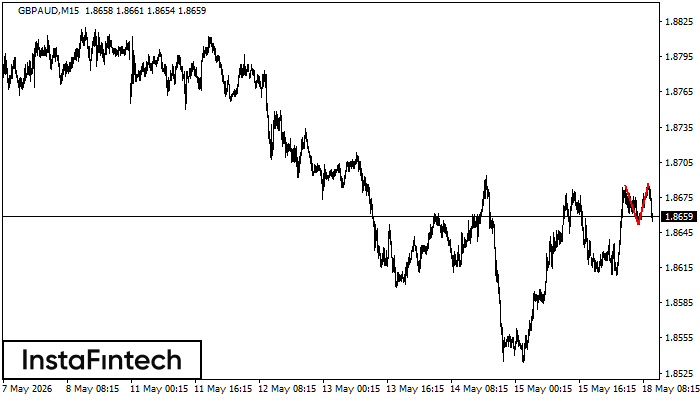
GBPAUD M15
Double Top
The Double Top pattern has been formed on GBPAUD M15. It signals that the trend has been changed from upwards to downwards. Probably, if the base of the pattern 1.8652 is broken, the downward movement will continue.