 EUR/USD H1 TIMEFRAME TECHNICAL ANALYSIS Market Overview and Trend
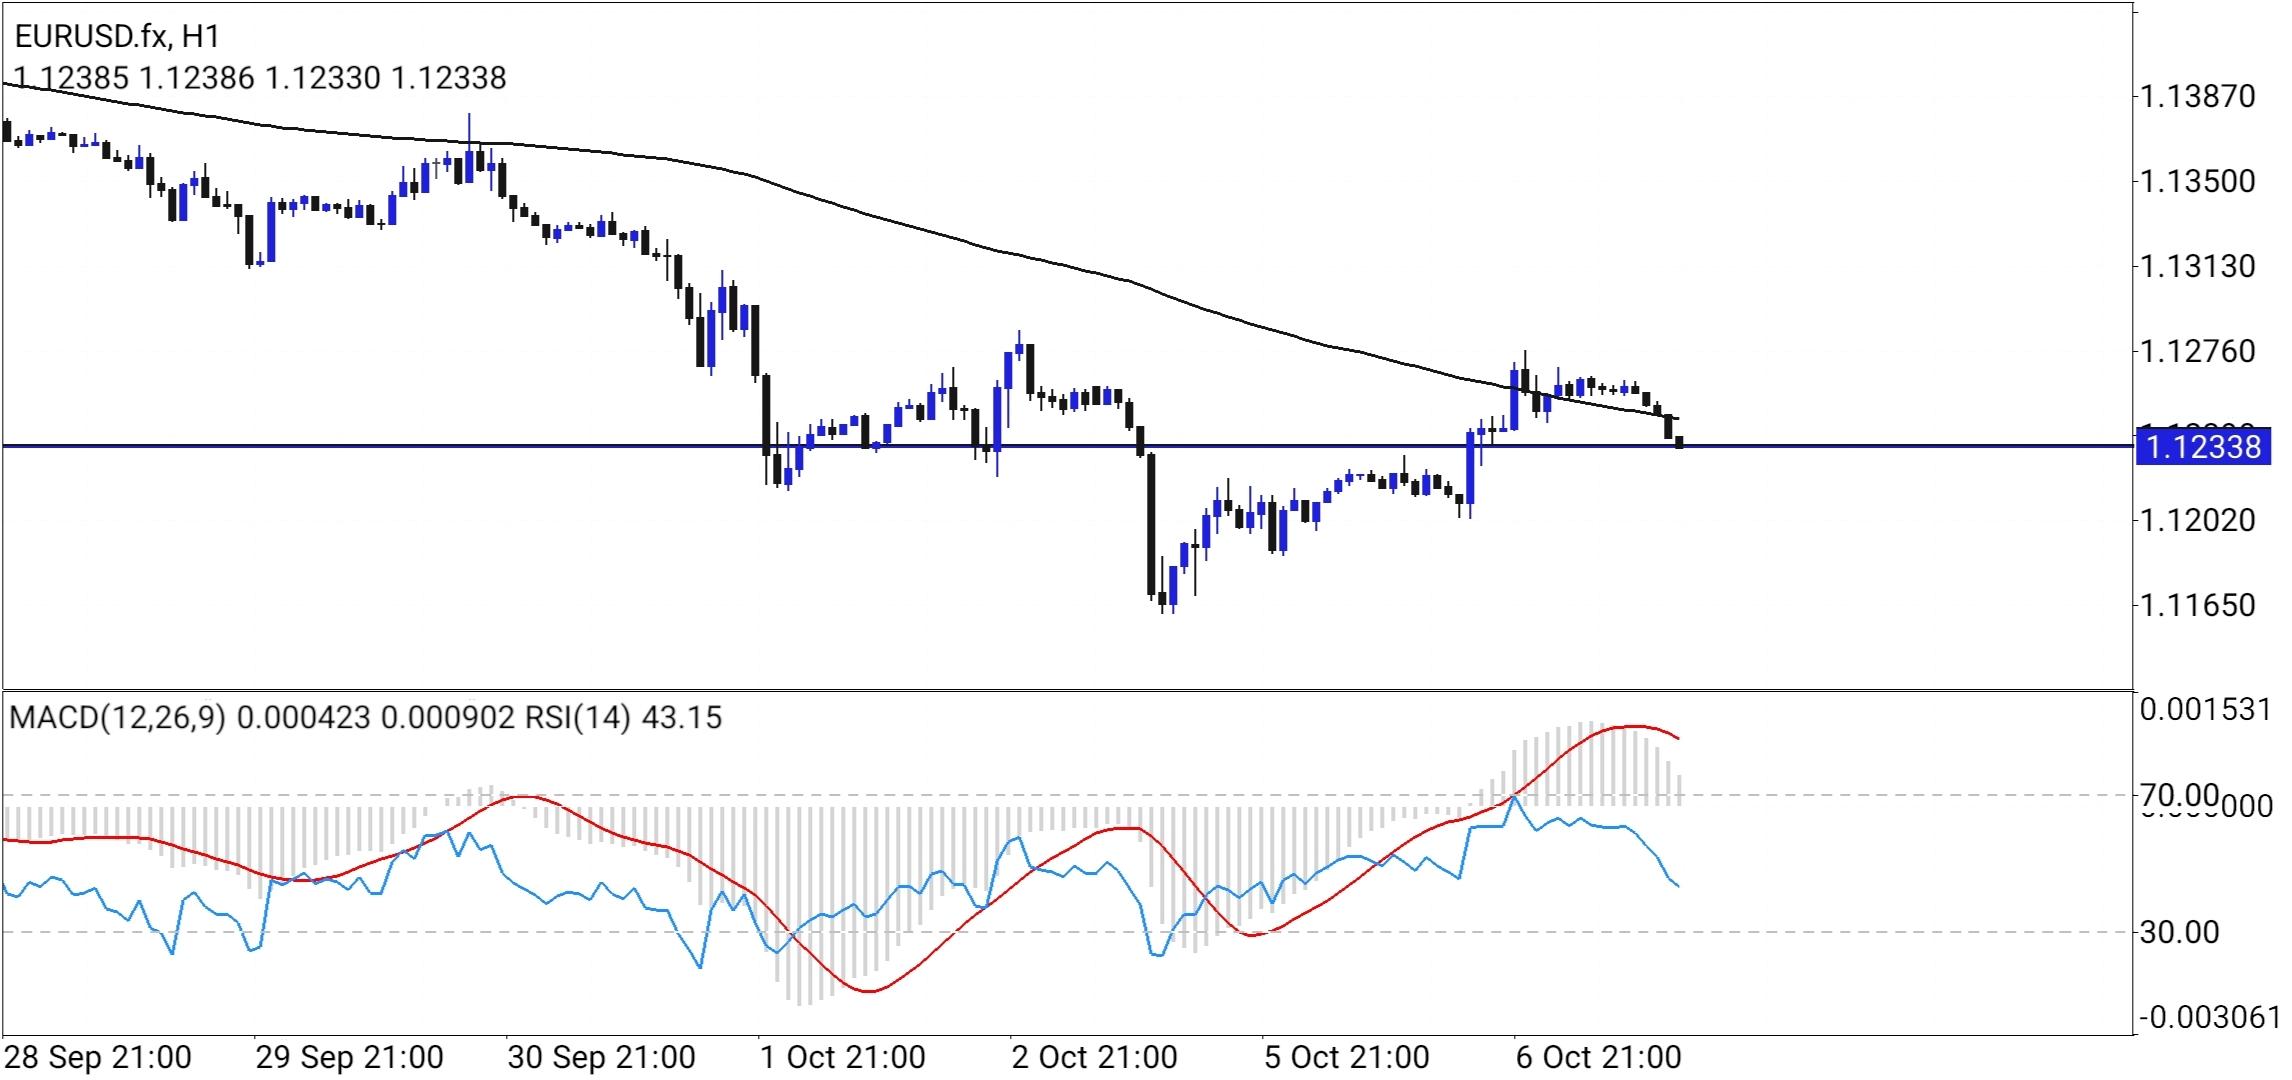
 The EURUSD pair is currently trading at 1.12338. The broader context on the H1 timeframe shows a bearish trend that began in late September, where the price declined from approximately 1.1380. A significant sell-off occurred around October 1st and 2nd, driving the price down to a local low of roughly 1.11650. Since that low, the market has undergone a corrective rally, attempting to recover lost ground. However, the overall structure remains bearish, characterized by a descending trendline (visible as the black curved line at the top of the chart) which has acted as dynamic resistance throughout the period.
Key Support and Resistance Levels • Resistance: The immediate resistance is the descending trendline and the recent swing high around 1.12760 (seen on October 6th). The price touched this area and was rejected, confirming the strength of the bearish trend. • Support: The critical support level is the horizontal blue line at 1.12338. The price is currently testing this level. A decisive break below this line would open the door to further downside. The next major support lies at the recent swing low of 1.11650.
Indicator Analysis The technical indicators in the bottom panel suggest that the recent bullish momentum is fading and a reversal to the downside is likely. • RSI (Relative Strength Index): The RSI(14) is currently reading 43.15. Looking at the chart, the RSI (likely represented by the red line which peaked near the 70.00 level around October 6th) has retreated from overbought territory. This decline from ~70 to ~43 indicates that buying pressure has exhausted and sellers are regaining control. • MACD (Moving Average Convergence Divergence): The MACD(12,26,9) shows signs of a bearish crossover. The histogram (grey bars), which had been positive during the recovery rally, is now shrinking and turning negative. The MACD lines appear to be crossing downwards, reinforcing the view that the corrective rally is over and the primary downtrend may be resuming.
Conclusion and Outlook The technical picture for EURUSD on the H1 timeframe is bearish. The price has failed to break above the long-term descending resistance trendline and has formed a lower high" around 1.12760. Currently, the price is breaking below the immediate support at 1.12338. If the current candle closes decisively below this level, it confirms a bearish continuation setup. Traders should watch for a drop toward the 1.12000 psychological level and potentially a retest of the 1.11650 low. Conversely, for the bulls to regain control, the price would need to reclaim 1.12338 and break above the 1.12760 resistance, which seems unlikely given the weakening momentum indicators.
*Die zur Verfügung gestellte Marktanalyse dient zu den Informationszwecken und sollte als Anforderung zur Eröffnung einer Transaktion nicht ausgelegt werden
 Deutsch
 Русский
 English
 Bahasa Indonesia
 Bahasa Malay
 ไทย
ไทย Español
 Български
 Français
 Tiếng Việt
 中文
中文 বাংলা
বাংলা हिन्दी
 Čeština
 Українська
 Română
