 English
  Русский
 Bahasa Indonesia
 Bahasa Malay
 ไทย
ไทย Español
 Deutsch
 Български
 Français
 Tiếng Việt
 中文
中文 বাংলা
বাংলা हिन्दी
 Čeština
 Українська
 Română
FX.co ★ Patterns #AAPL | Apple Inc. Stock Price

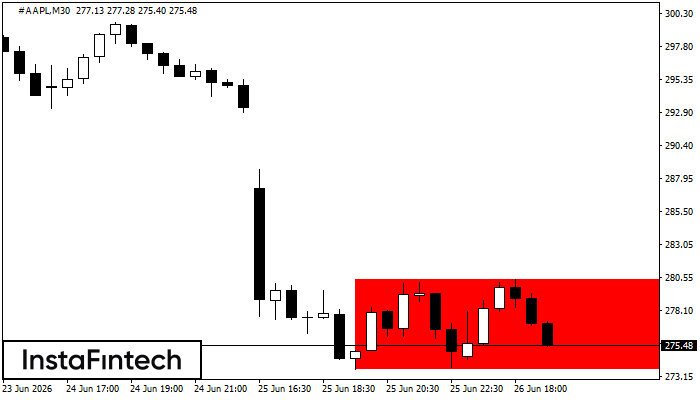
#AAPL M30
Bearish Rectangle
According to the chart of M30, #AAPL formed the Bearish Rectangle. The pattern indicates a trend continuation. The upper border is 280.43, the lower border is 273.74. The signal means that a short position should be opened after fixing a price below the lower border 273.74 of the Bearish Rectangle.
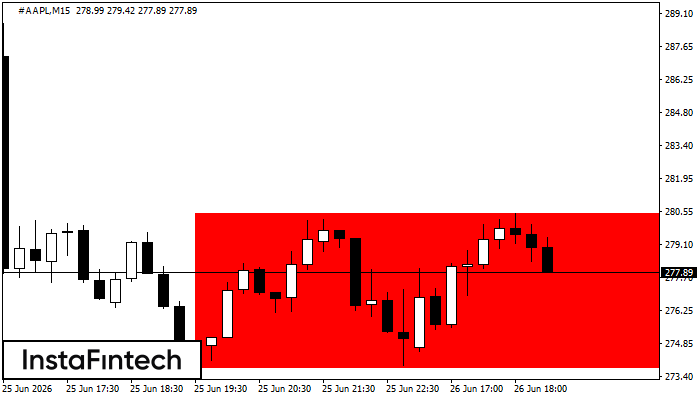
#AAPL M15
Bearish Rectangle
According to the chart of M15, #AAPL formed the Bearish Rectangle which is a pattern of a trend continuation. The pattern is contained within the following borders: lower border 273.74 – 273.74 and upper border 280.43 – 280.43. In case the lower border is broken, the instrument is likely to follow the downward trend.
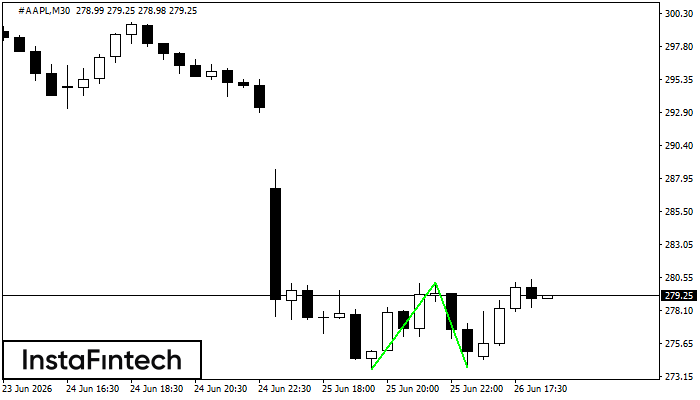
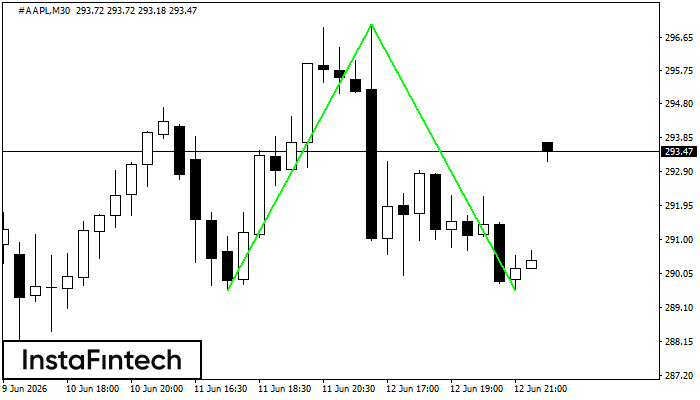
#AAPL M30
Double Bottom
The Double Bottom pattern has been formed on #AAPL M30. This formation signals a reversal of the trend from downwards to upwards. The signal is that a buy trade should be opened after the upper boundary of the pattern 280.17 is broken. The further movements will rely on the width of the current pattern 643 points.
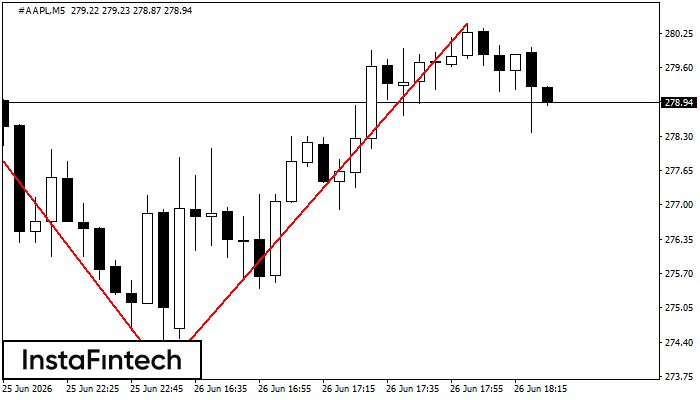
#AAPL M5
Double Top
On the chart of #AAPL M5 the Double Top reversal pattern has been formed. Characteristics: the upper boundary 280.43; the lower boundary 273.87; the width of the pattern 656 points. The signal: a break of the lower boundary will cause continuation of the downward trend targeting the 273.72 level.
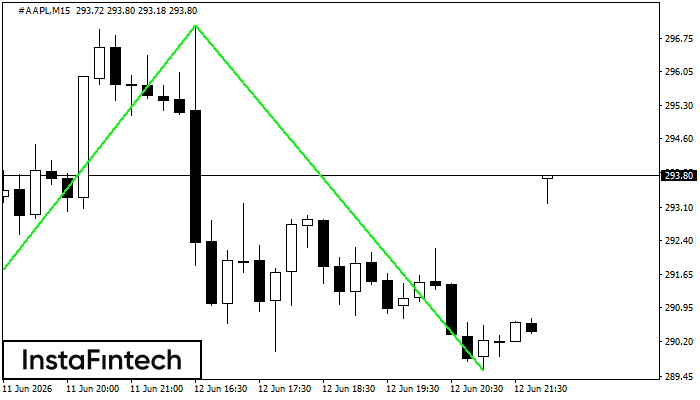
#AAPL M15
Double Bottom
The Double Bottom pattern has been formed on #AAPL M15. Characteristics: the support level 273.74; the resistance level 280.17; the width of the pattern 643 points. If the resistance level is broken, a change in the trend can be predicted with the first target point lying at the distance of 630 points.
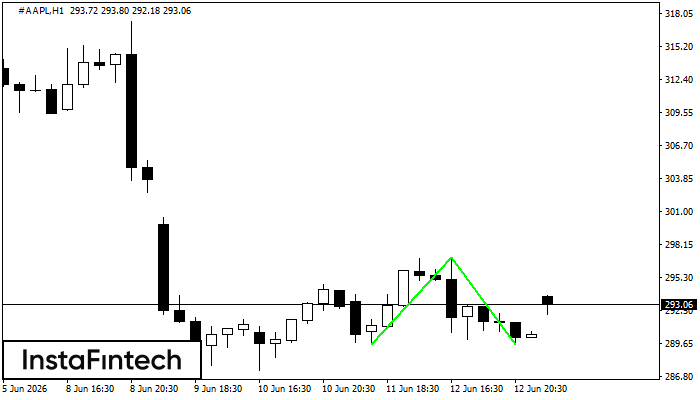
#AAPL H1
Double Bottom
The Double Bottom pattern has been formed on #AAPL H1; the upper boundary is 297.04; the lower boundary is 289.59. The width of the pattern is 746 points. In case of a break of the upper boundary 297.04, a change in the trend can be predicted where the width of the pattern will coincide with the distance to a possible take profit level.
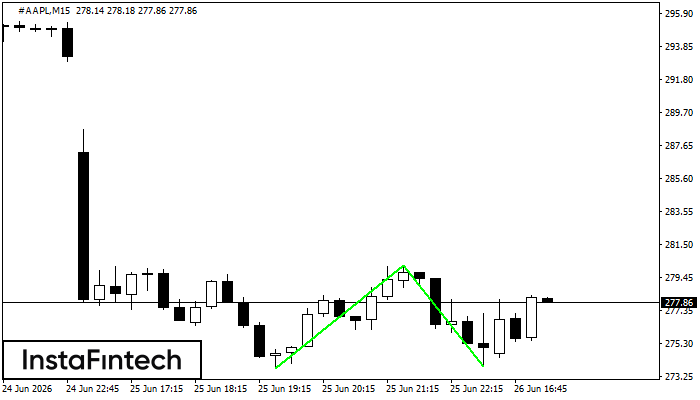
#AAPL M15
Double Bottom
The Double Bottom pattern has been formed on #AAPL M15. This formation signals a reversal of the trend from downwards to upwards. The signal is that a buy trade should be opened after the upper boundary of the pattern 297.04 is broken. The further movements will rely on the width of the current pattern 746 points.
#AAPL M30
Double Bottom
The Double Bottom pattern has been formed on #AAPL M30; the upper boundary is 297.04; the lower boundary is 289.59. The width of the pattern is 746 points. In case of a break of the upper boundary 297.04, a change in the trend can be predicted where the width of the pattern will coincide with the distance to a possible take profit level.
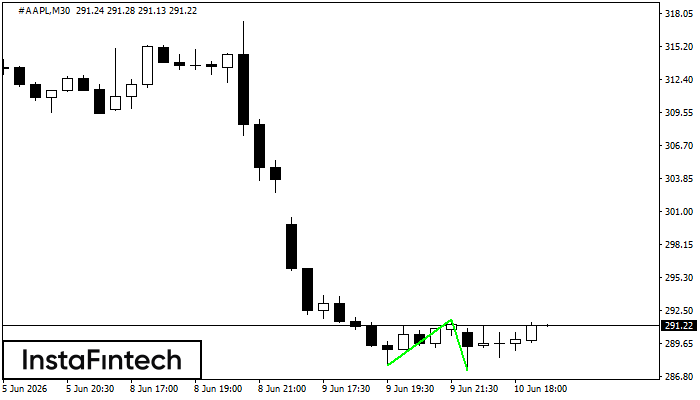
#AAPL M30
Double Bottom
The Double Bottom pattern has been formed on #AAPL M30. Characteristics: the support level 287.76; the resistance level 291.76; the width of the pattern 400 points. If the resistance level is broken, a change in the trend can be predicted with the first target point lying at the distance of 440 points.
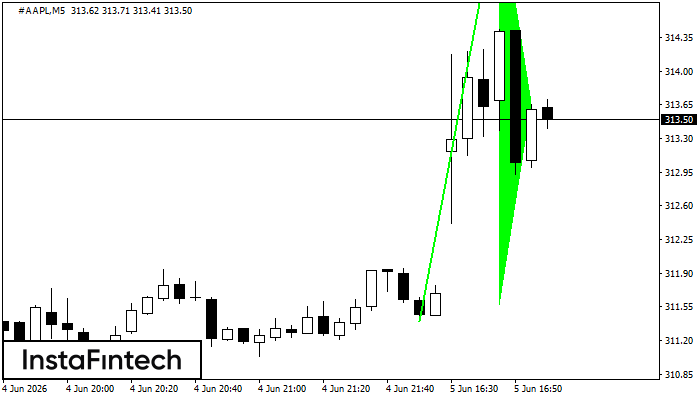
#AAPL M5
Bullish pennant
The Bullish pennant signal – Trading instrument #AAPL M5, continuation pattern. Forecast: it is possible to set up a buy position above the pattern’s high of 315.78, with the prospect of the next move being a projection of the flagpole height.