 English
  Русский
 Bahasa Indonesia
 Bahasa Malay
 ไทย
ไทย Español
 Deutsch
 Български
 Français
 Tiếng Việt
 中文
中文 বাংলা
বাংলা हिन्दी
 Čeština
 Українська
 Română
FX.co ★ Patterns EURCAD | Euro (EUR) to Canadian Dollar (CAD) Rate in the Forex market

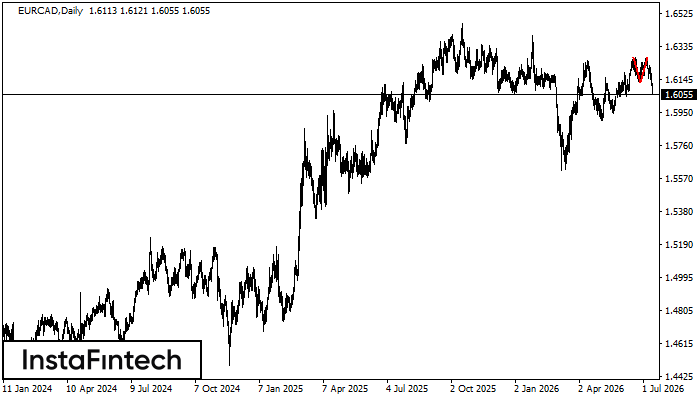
EURCAD D1
Double Top
On the chart of EURCAD D1 the Double Top reversal pattern has been formed. Characteristics: the upper boundary 1.6271; the lower boundary 1.6127; the width of the pattern 144 points. The signal: a break of the lower boundary will cause continuation of the downward trend targeting the 1.6087 level.

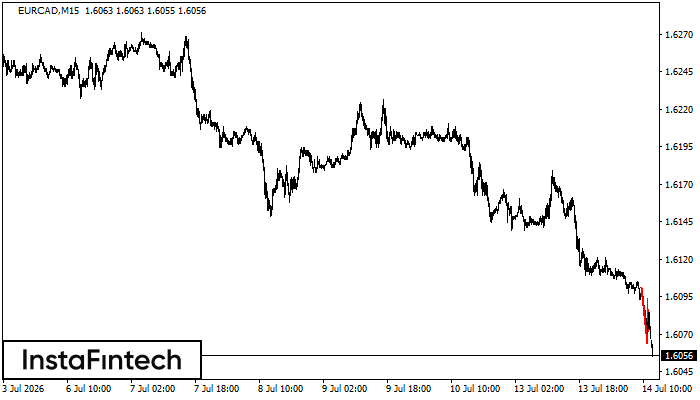
EURCAD M15
Bearish Flag
The Bearish Flag pattern has been formed on the chart EURCAD M15 which signals that the downward trend will continue. If the price breaks below the low at 1.6064, then it is most likely to move further downwards. The price will likely move by the number of points which equals the length of the flag pole (15 points).
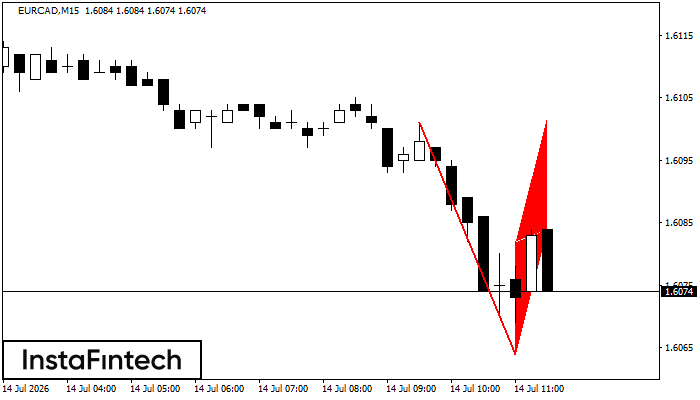
EURCAD M15
Bearish pennant
The Bearish pennant pattern has formed on the EURCAD M15 chart. This pattern type is characterized by a slight slowdown after which the price will move in the direction of the original trend. In case the price fixes below the pattern’s low of 1.6064, a trader will be able to successfully enter the sell position.
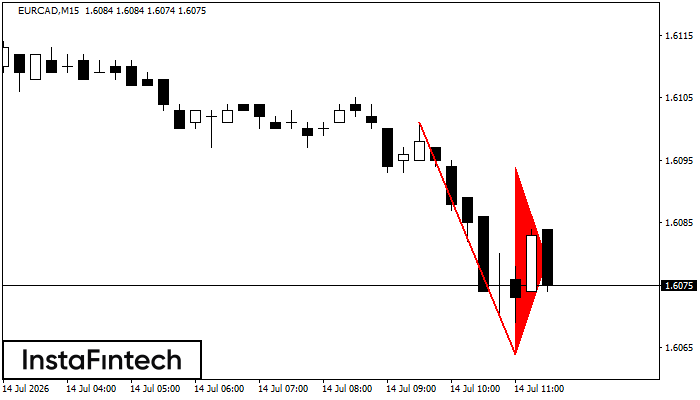
EURCAD M15
Bearish Flag
The Bearish Flag pattern has been formed on the chart EURCAD M15 which signals that the downward trend will continue. If the price breaks below the low at 1.6064, then it is most likely to move further downwards. The price will likely move by the number of points which equals the length of the flag pole (15 points).
EURCAD M15
Bearish pennant
The Bearish pennant pattern has formed on the EURCAD M15 chart. This pattern type is characterized by a slight slowdown after which the price will move in the direction of the original trend. In case the price fixes below the pattern’s low of 1.6064, a trader will be able to successfully enter the sell position.
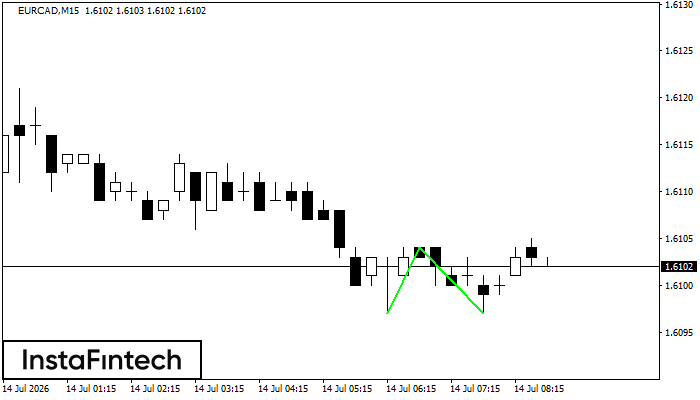
EURCAD M15
Double Bottom
The Double Bottom pattern has been formed on EURCAD M15; the upper boundary is 1.6104; the lower boundary is 1.6097. The width of the pattern is 7 points. In case of a break of the upper boundary 1.6104, a change in the trend can be predicted where the width of the pattern will coincide with the distance to a possible take profit level.
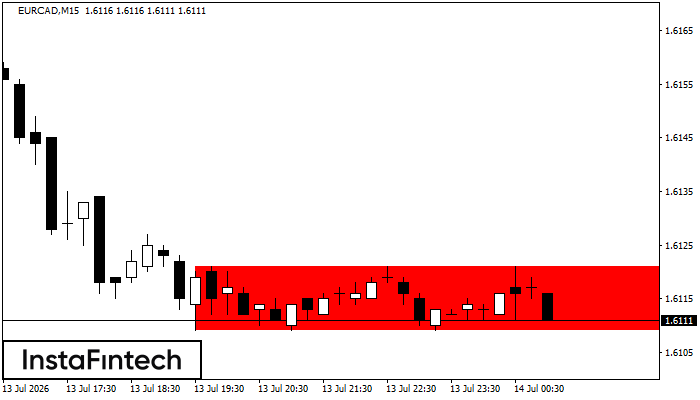
EURCAD M15
Bearish Rectangle
According to the chart of M15, EURCAD formed the Bearish Rectangle. This type of a pattern indicates a trend continuation. It consists of two levels: resistance 1.6121 - 0.0000 and support 1.6109 – 1.6109. In case the resistance level 1.6109 - 1.6109 is broken, the instrument is likely to follow the bearish trend.
EURCAD M15
Double Bottom
The Double Bottom pattern has been formed on EURCAD M15. Characteristics: the support level 1.6109; the resistance level 1.6121; the width of the pattern 12 points. If the resistance level is broken, a change in the trend can be predicted with the first target point lying at the distance of 12 points.
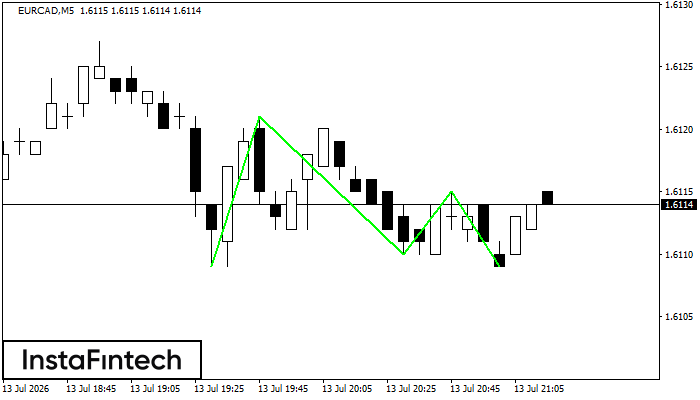
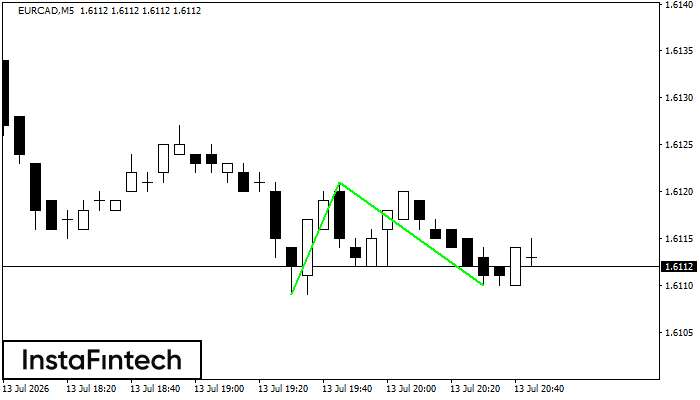
EURCAD M5
Triple Bottom
The Triple Bottom pattern has formed on the chart of EURCAD M5. Features of the pattern: The lower line of the pattern has coordinates 1.6121 with the upper limit 1.6121/1.6115, the projection of the width is 12 points. The formation of the Triple Bottom pattern most likely indicates a change in the trend from downward to upward. This means that in the event of a breakdown of the resistance level 1.6109, the price is most likely to continue the upward movement.
EURCAD M5
Double Bottom
The Double Bottom pattern has been formed on EURCAD M5. This formation signals a reversal of the trend from downwards to upwards. The signal is that a buy trade should be opened after the upper boundary of the pattern 1.6121 is broken. The further movements will rely on the width of the current pattern 12 points.