 English
  Русский
 Bahasa Indonesia
 Bahasa Malay
 ไทย
ไทย Español
 Deutsch
 Български
 Français
 Tiếng Việt
 中文
中文 বাংলা
বাংলা हिन्दी
 Čeština
 Українська
 Română
FX.co ★ Patterns EURCHF | Euro (EUR) to Swiss Franc (CHF) Rate in the Forex market

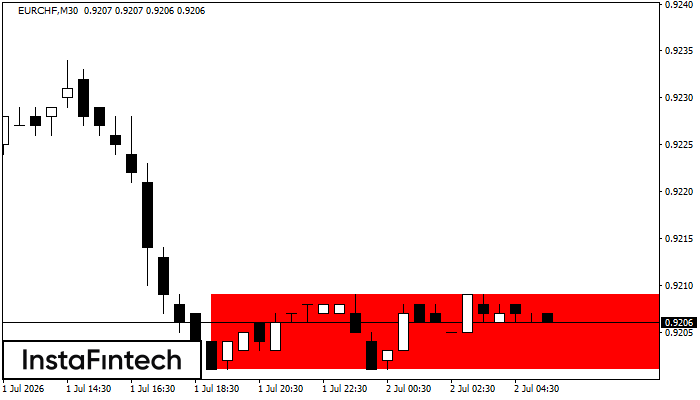
EURCHF M30
Bearish Rectangle
According to the chart of M30, EURCHF formed the Bearish Rectangle. The pattern indicates a trend continuation. The upper border is 0.9209, the lower border is 0.9201. The signal means that a short position should be opened after fixing a price below the lower border 0.9201 of the Bearish Rectangle.
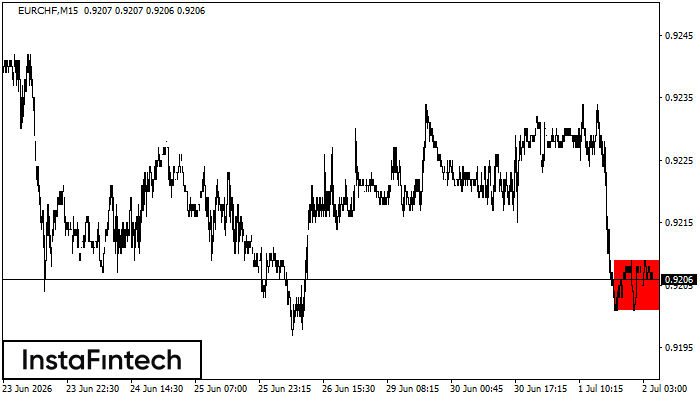
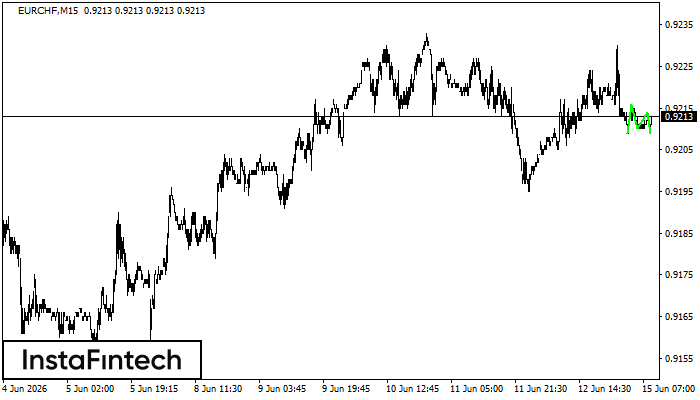
EURCHF M15
Bearish Rectangle
According to the chart of M15, EURCHF formed the Bearish Rectangle. This type of a pattern indicates a trend continuation. It consists of two levels: resistance 0.9209 - 0.0000 and support 0.9201 – 0.9201. In case the resistance level 0.9201 - 0.9201 is broken, the instrument is likely to follow the bearish trend.
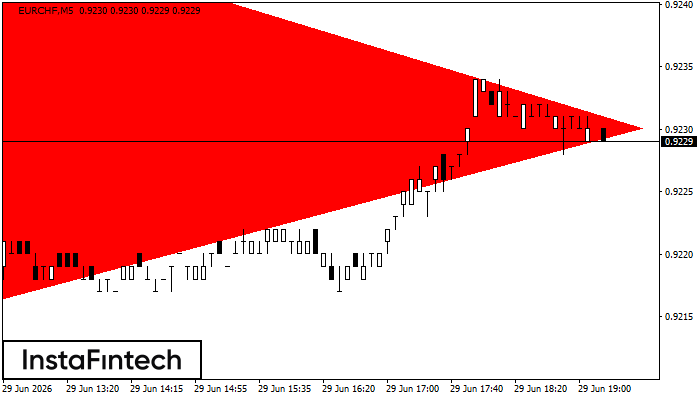
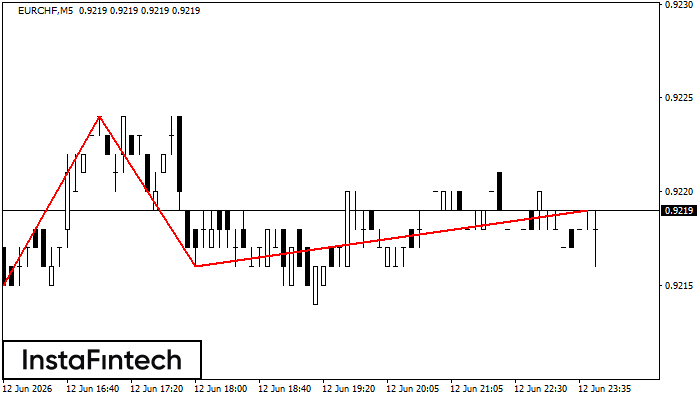
EURCHF M5
Bearish Symmetrical Triangle
According to the chart of M5, EURCHF formed the Bearish Symmetrical Triangle pattern. Trading recommendations: A breach of the lower border 0.9216 is likely to encourage a continuation of the downward trend.
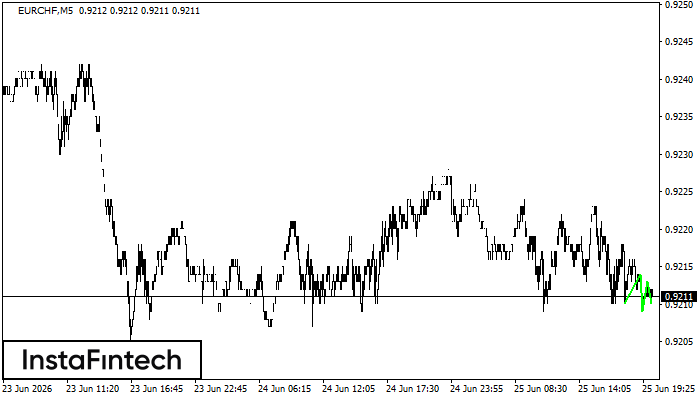
EURCHF M5
Triple Bottom
The Triple Bottom pattern has been formed on EURCHF M5. It has the following characteristics: resistance level 0.9214/0.9213; support level 0.9210/0.9210; the width is 4 points. In the event of a breakdown of the resistance level of 0.9214, the price is likely to continue an upward movement at least to 0.9224.
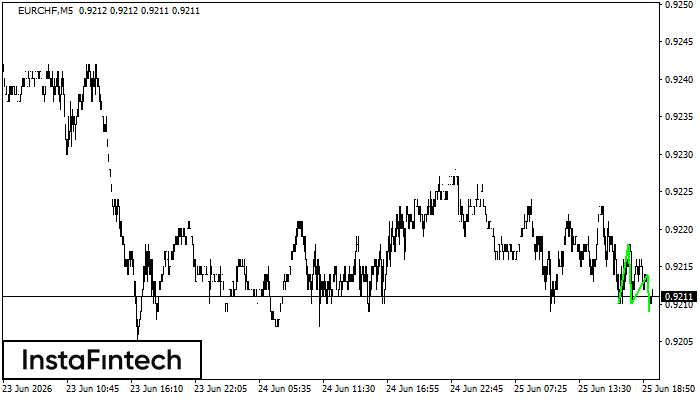
EURCHF M5
Triple Bottom
The Triple Bottom pattern has formed on the chart of EURCHF M5. Features of the pattern: The lower line of the pattern has coordinates 0.9218 with the upper limit 0.9218/0.9214, the projection of the width is 8 points. The formation of the Triple Bottom pattern most likely indicates a change in the trend from downward to upward. This means that in the event of a breakdown of the resistance level 0.9210, the price is most likely to continue the upward movement.
EURCHF M5
Double Top
On the chart of EURCHF M5 the Double Top reversal pattern has been formed. Characteristics: the upper boundary 0.9258; the lower boundary 0.9248; the width of the pattern 10 points. The signal: a break of the lower boundary will cause continuation of the downward trend targeting the 0.9233 level.
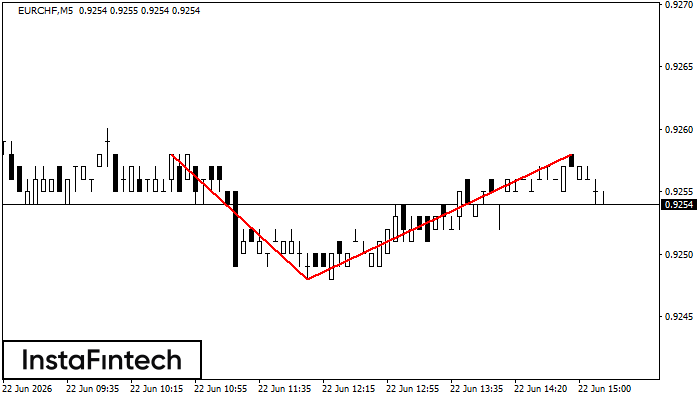
EURCHF M5
Double Top
The Double Top pattern has been formed on EURCHF M5. It signals that the trend has been changed from upwards to downwards. Probably, if the base of the pattern 0.9252 is broken, the downward movement will continue.
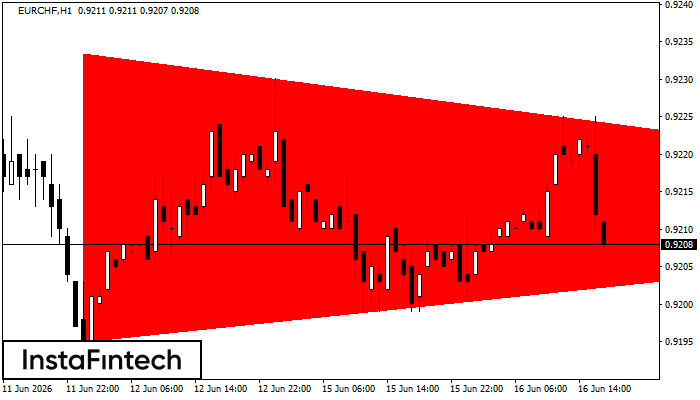
EURCHF H1
Bearish Symmetrical Triangle
According to the chart of H1, EURCHF formed the Bearish Symmetrical Triangle pattern. Description: The lower border is 0.9195/0.9212 and upper border is 0.9233/0.9212. The pattern width is measured on the chart at -38 pips. The formation of the Bearish Symmetrical Triangle pattern evidently signals a continuation of the downward trend. In other words, if the scenario comes true and EURCHF breaches the lower border, the price could continue its move toward 0.9172.
EURCHF M15
Triple Bottom
The Triple Bottom pattern has been formed on EURCHF M15. It has the following characteristics: resistance level 0.9216/0.9214; support level 0.9209/0.9209; the width is 7 points. In the event of a breakdown of the resistance level of 0.9216, the price is likely to continue an upward movement at least to 0.9233.
EURCHF M5
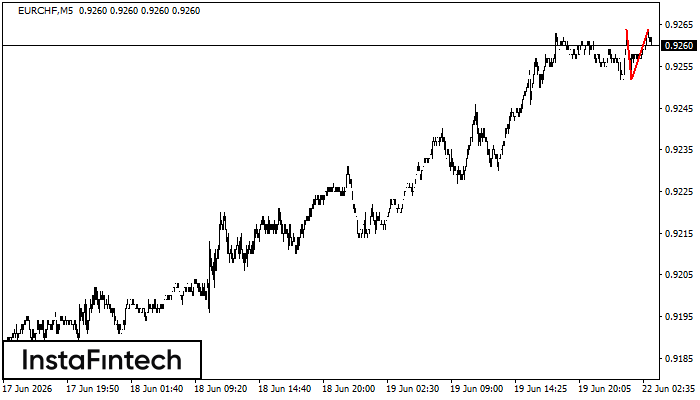
Head and Shoulders
According to the chart of M5, EURCHF formed the Head and Shoulders pattern. The Head’s top is set at 0.9224 while the median line of the Neck is found at 0.9215/0.9216. The formation of the Head and Shoulders pattern evidently signals a reversal of the upward trend. In other words, in case the scenario comes true, the price of EURCHF will go towards 0.9201.