 English
  Русский
 Bahasa Indonesia
 Bahasa Malay
 ไทย
ไทย Español
 Deutsch
 Български
 Français
 Tiếng Việt
 中文
中文 বাংলা
বাংলা हिन्दी
 Čeština
 Українська
 Română
FX.co ★ Patterns EURUSD | Euro (EUR) to US Dollar (USD) Rate in the Forex market

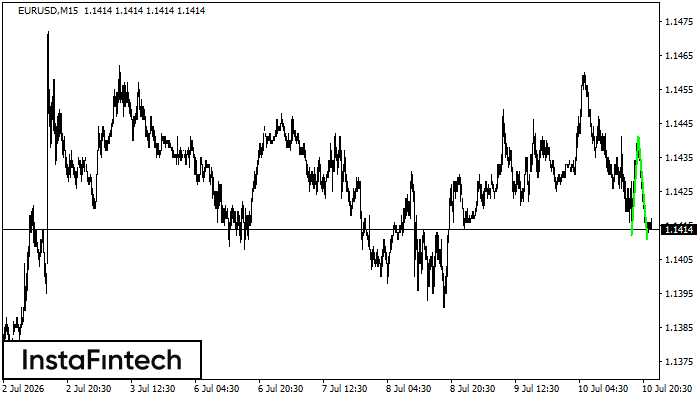
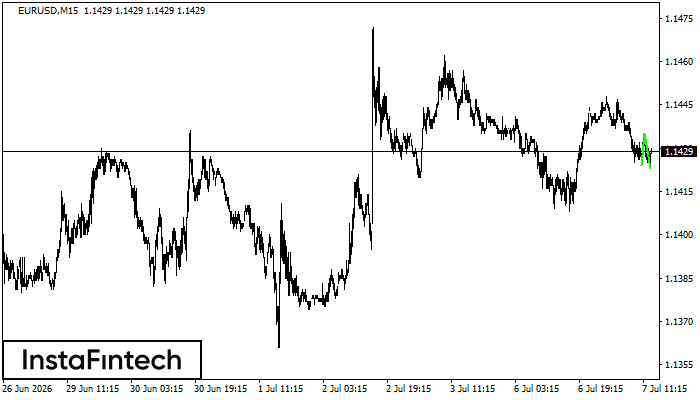
EURUSD M15
Double Bottom
The Double Bottom pattern has been formed on EURUSD M15; the upper boundary is 1.1441; the lower boundary is 1.1411. The width of the pattern is 29 points. In case of a break of the upper boundary 1.1441, a change in the trend can be predicted where the width of the pattern will coincide with the distance to a possible take profit level.
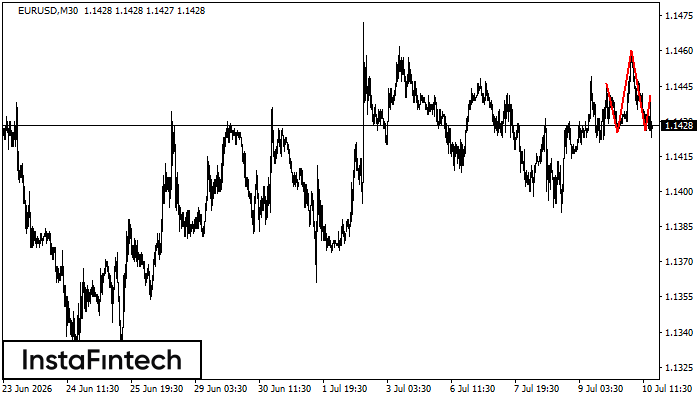
EURUSD M30
Head and Shoulders
The EURUSD M30 formed the Head and Shoulders pattern with the following features: The Head’s top is at 1.1460, the Neckline and the upward angle are at 1.1425/1.1426. The formation of this pattern can bring about changes in the current trend from bullish to bearish. In case the pattern triggers the expected changes, the price of EURUSD will go towards 1.1396.
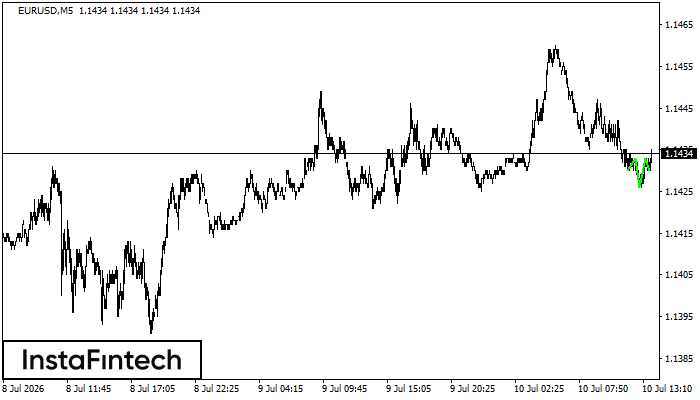
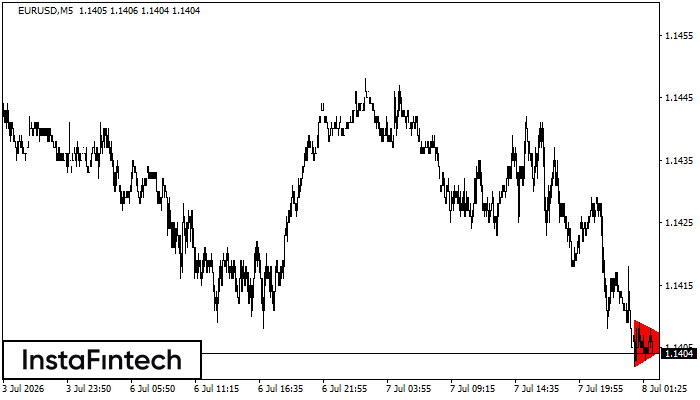
EURUSD M5
Inverse Head and Shoulder
According to M5, EURUSD is shaping the technical pattern – the Inverse Head and Shoulder. In case the Neckline 1.1433/1.1433 is broken out, the instrument is likely to move toward 1.1448.
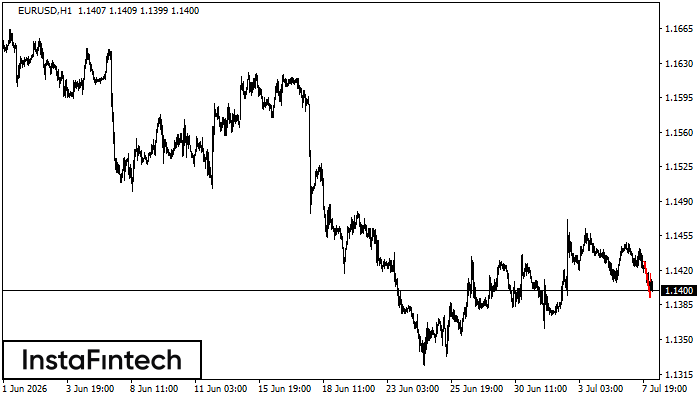
EURUSD H1
Bearish pennant
The Bearish pennant pattern has formed on the EURUSD H1 chart. It signals potential continuation of the existing trend. Specifications: the pattern’s bottom has the coordinate of 1.1393; the projection of the flagpole height is equal to 36 pips. In case the price breaks out the pattern’s bottom of 1.1393, the downtrend is expected to continue for further level 1.1353.
EURUSD M5
Bearish Symmetrical Triangle
According to the chart of M5, EURUSD formed the Bearish Symmetrical Triangle pattern. Description: The lower border is 1.1402/1.1406 and upper border is 1.1409/1.1406. The pattern width is measured on the chart at -7 pips. The formation of the Bearish Symmetrical Triangle pattern evidently signals a continuation of the downward trend. In other words, if the scenario comes true and EURUSD breaches the lower border, the price could continue its move toward 1.1391.
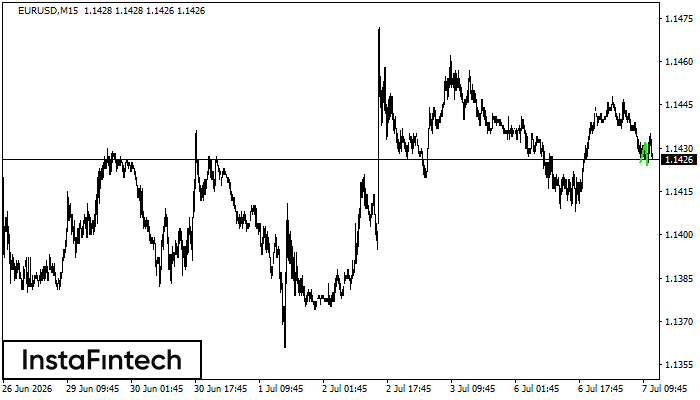
EURUSD M15
Double Bottom
The Double Bottom pattern has been formed on EURUSD M15; the upper boundary is 1.1435; the lower boundary is 1.1423. The width of the pattern is 11 points. In case of a break of the upper boundary 1.1435, a change in the trend can be predicted where the width of the pattern will coincide with the distance to a possible take profit level.
EURUSD M15
Double Bottom
The Double Bottom pattern has been formed on EURUSD M15. Characteristics: the support level 1.1425; the resistance level 1.1432; the width of the pattern 7 points. If the resistance level is broken, a change in the trend can be predicted with the first target point lying at the distance of 8 points.
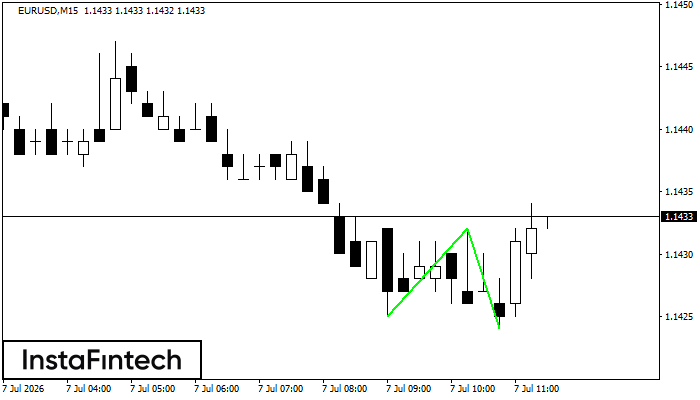
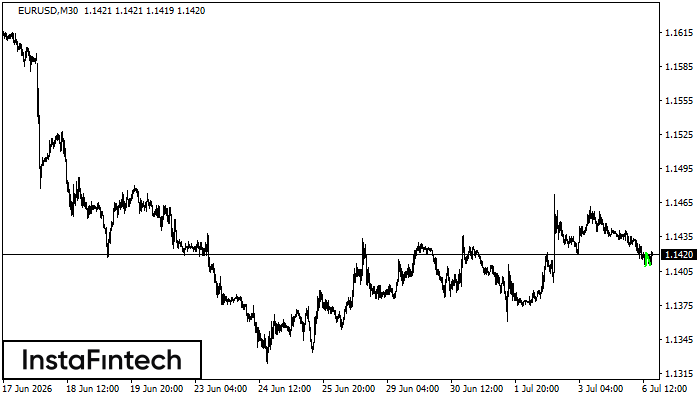
EURUSD M30
Double Bottom
The Double Bottom pattern has been formed on EURUSD M30. This formation signals a reversal of the trend from downwards to upwards. The signal is that a buy trade should be opened after the upper boundary of the pattern 1.1421 is broken. The further movements will rely on the width of the current pattern 12 points.
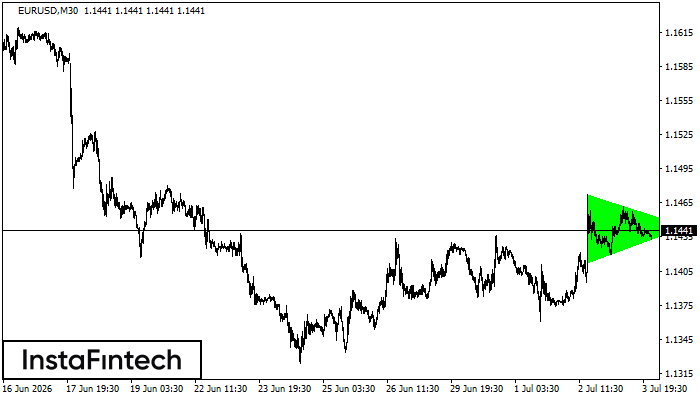
EURUSD M30
Bullish Symmetrical Triangle
According to the chart of M30, EURUSD formed the Bullish Symmetrical Triangle pattern. Description: This is the pattern of a trend continuation. 1.1472 and 1.1413 are the coordinates of the upper and lower borders respectively. The pattern width is measured on the chart at 59 pips. Outlook: If the upper border 1.1472 is broken, the price is likely to continue its move by 1.1474.