 English
  Русский
 Bahasa Indonesia
 Bahasa Malay
 ไทย
ไทย Español
 Deutsch
 Български
 Français
 Tiếng Việt
 中文
中文 বাংলা
বাংলা हिन्दी
 Čeština
 Українська
 Română
FX.co ★ Patterns GBPCHF | British Pound (GBP) to Swiss Franc (CHF) Rate in the Forex market

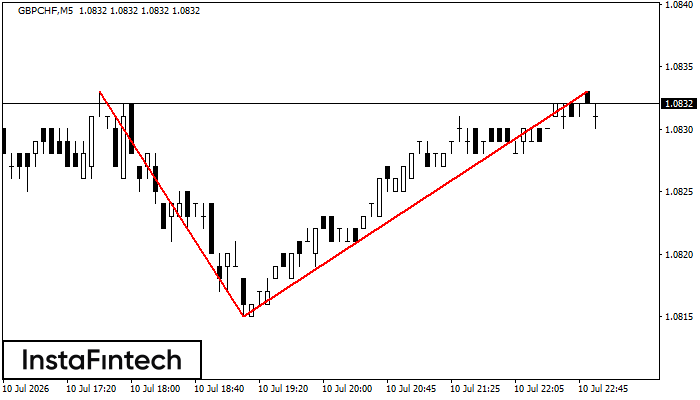
GBPCHF M5
Double Top
The Double Top pattern has been formed on GBPCHF M5. It signals that the trend has been changed from upwards to downwards. Probably, if the base of the pattern 1.0815 is broken, the downward movement will continue.
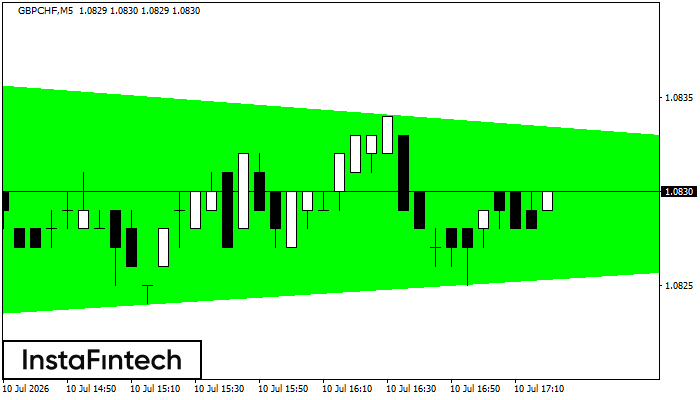
GBPCHF M5
Bullish Symmetrical Triangle
According to the chart of M5, GBPCHF formed the Bullish Symmetrical Triangle pattern. Description: This is the pattern of a trend continuation. 1.0836 and 1.0823 are the coordinates of the upper and lower borders respectively. The pattern width is measured on the chart at 13 pips. Outlook: If the upper border 1.0836 is broken, the price is likely to continue its move by 1.0844.
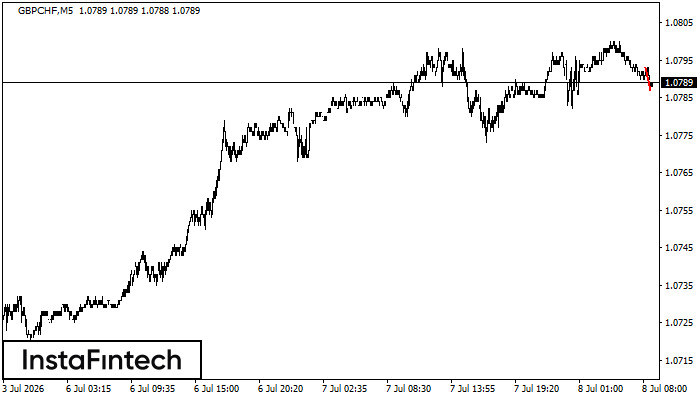
GBPCHF M5
Bearish Flag
The Bearish Flag pattern has been formed on GBPCHF at M5. The lower boundary of the pattern is located at 1.0787/1.0789 while the upper boundary lies at 1.0787/1.0789. The projection of the flagpole is 6 points. This formation signals that the downward trend is most likely to continue. Therefore, if the level of 1.0787 is broken, the price will move further downwards.
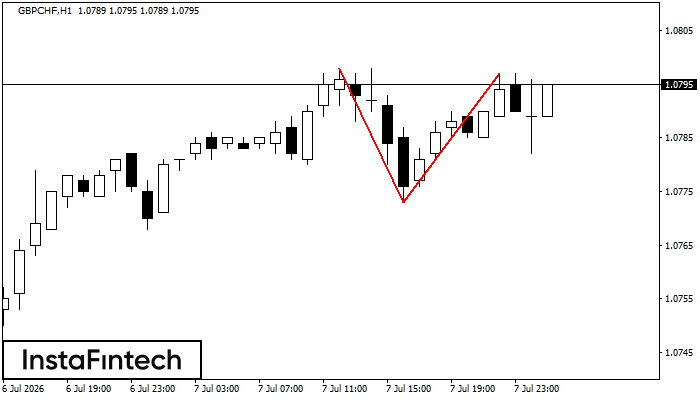
GBPCHF H1
Double Top
The Double Top reversal pattern has been formed on GBPCHF H1. Characteristics: the upper boundary 1.0798; the lower boundary 1.0773; the width of the pattern is 24 points. Sell trades are better to be opened below the lower boundary 1.0773 with a possible movements towards the 1.0733 level.
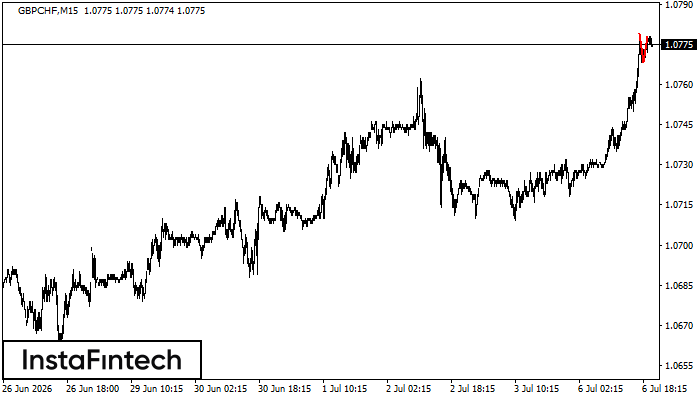
GBPCHF M15
Triple Top
The Triple Top pattern has formed on the chart of the GBPCHF M15. Features of the pattern: borders have an ascending angle; the lower line of the pattern has the coordinates 1.0768/1.0782 with the upper limit 1.0782/1.0789; the projection of the width is 14 points. The formation of the Triple Top figure most likely indicates a change in the trend from upward to downward. This means that in the event of a breakdown of the support level of 1.0768, the price is most likely to continue the downward movement.
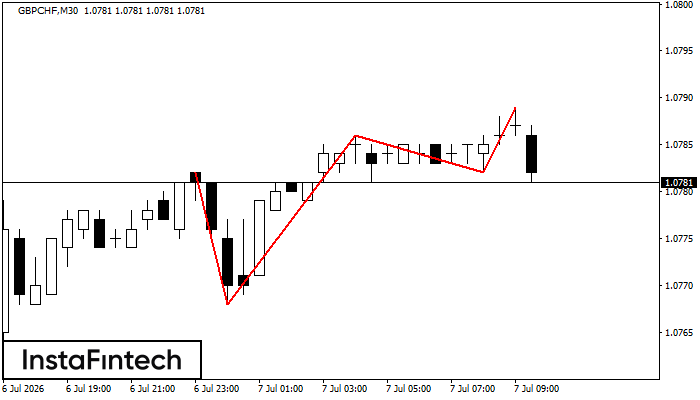
GBPCHF M30
Triple Top
On the chart of the GBPCHF M30 trading instrument, the Triple Top pattern that signals a trend change has formed. It is possible that after formation of the third peak, the price will try to break through the resistance level 1.0768, where we advise to open a trading position for sale. Take profit is the projection of the pattern’s width, which is 14 points.
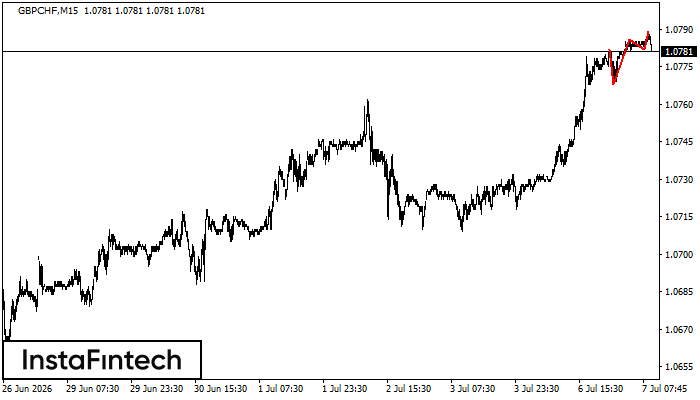
GBPCHF M15
Double Top
The Double Top pattern has been formed on GBPCHF M15. It signals that the trend has been changed from upwards to downwards. Probably, if the base of the pattern 1.0768 is broken, the downward movement will continue.
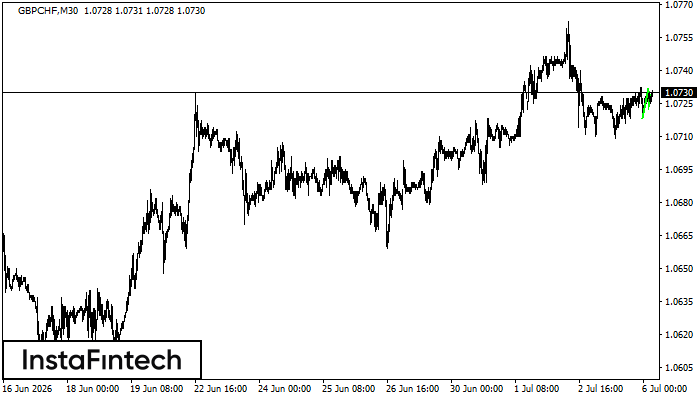
GBPCHF M30
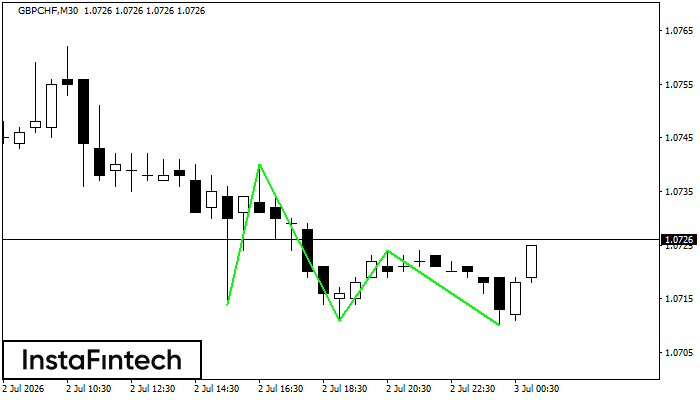
Bullish pennant
The Bullish pennant signal – Trading instrument GBPCHF M30, continuation pattern. Forecast: it is possible to set up a buy position above the pattern’s high of 1.0732, with the prospect of the next move being a projection of the flagpole height.
GBPCHF M30
Bearish Rectangle
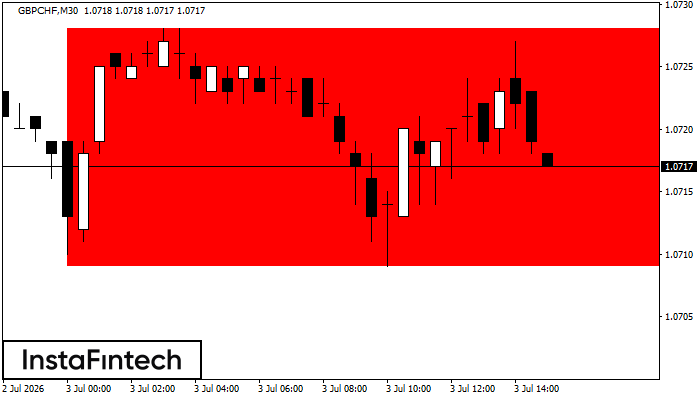
According to the chart of M30, GBPCHF formed the Bearish Rectangle. This type of a pattern indicates a trend continuation. It consists of two levels: resistance 1.0728 - 0.0000 and support 1.0709 – 1.0709. In case the resistance level 1.0709 - 1.0709 is broken, the instrument is likely to follow the bearish trend.
GBPCHF M30
Triple Bottom
The Triple Bottom pattern has been formed on GBPCHF M30. It has the following characteristics: resistance level 1.0740/1.0724; support level 1.0714/1.0710; the width is 26 points. In the event of a breakdown of the resistance level of 1.0740, the price is likely to continue an upward movement at least to 1.0741.