 English
  Русский
 Bahasa Indonesia
 Bahasa Malay
 ไทย
ไทย Español
 Deutsch
 Български
 Français
 Tiếng Việt
 中文
中文 বাংলা
বাংলা हिन्दी
 Čeština
 Українська
 Română
FX.co ★ Patterns GOLD | Gold Rate in the Forex market

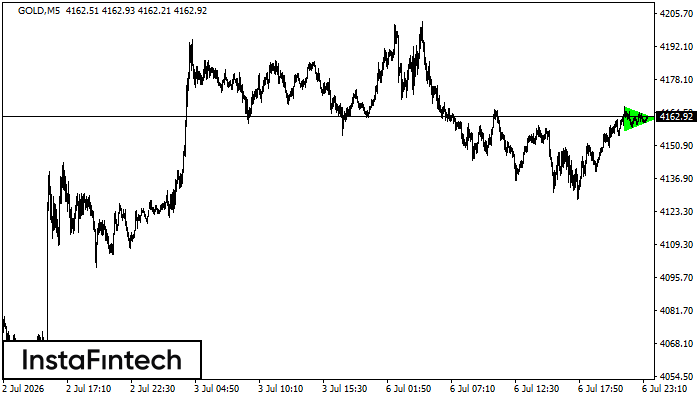
GOLD M5
Bullish Symmetrical Triangle
According to the chart of M5, GOLD formed the Bullish Symmetrical Triangle pattern. The lower border of the pattern touches the coordinates 4157.08/4162.16 whereas the upper border goes across 4166.99/4162.16. If the Bullish Symmetrical Triangle pattern is in progress, this evidently signals a further upward trend. In other words, in case the scenario comes true, the price of GOLD will breach the upper border to head for 4162.31.
GOLD M5
Double Top
The Double Top pattern has been formed on GOLD M5. It signals that the trend has been changed from upwards to downwards. Probably, if the base of the pattern 4170.13 is broken, the downward movement will continue.
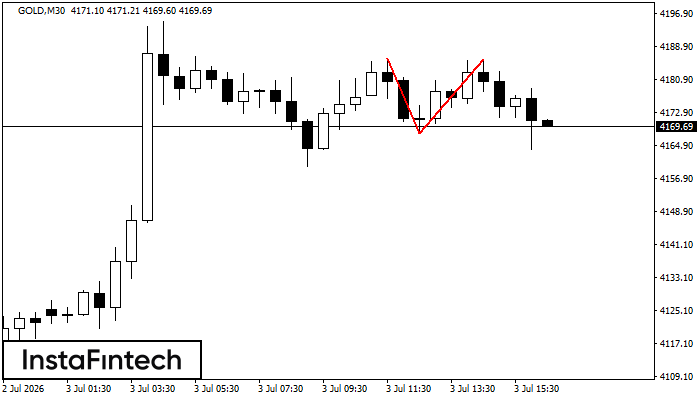
GOLD M30
Double Top
The Double Top pattern has been formed on GOLD M30. It signals that the trend has been changed from upwards to downwards. Probably, if the base of the pattern 4167.98 is broken, the downward movement will continue.
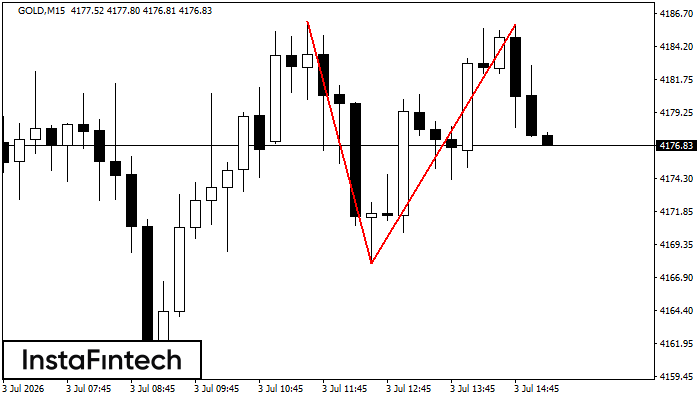
GOLD M15
Double Top
On the chart of GOLD M15 the Double Top reversal pattern has been formed. Characteristics: the upper boundary 4185.83; the lower boundary 4167.98; the width of the pattern 1785 points. The signal: a break of the lower boundary will cause continuation of the downward trend targeting the 4167.75 level.
GOLD M5
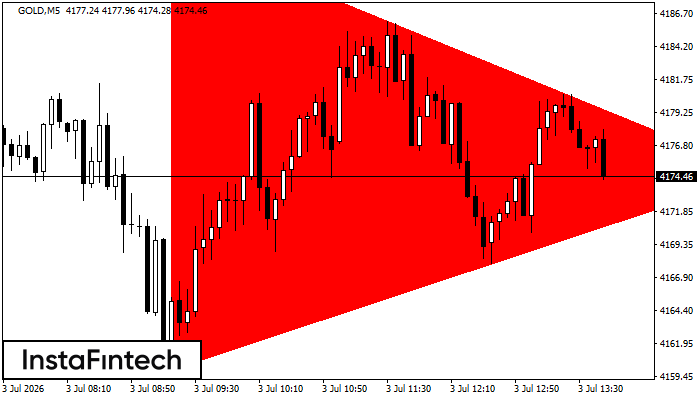
Bearish Symmetrical Triangle
According to the chart of M5, GOLD formed the Bearish Symmetrical Triangle pattern. This pattern signals a further downward trend in case the lower border 4160.01 is breached. Here, a hypothetical profit will equal the width of the available pattern that is -3278 pips.
GOLD M5
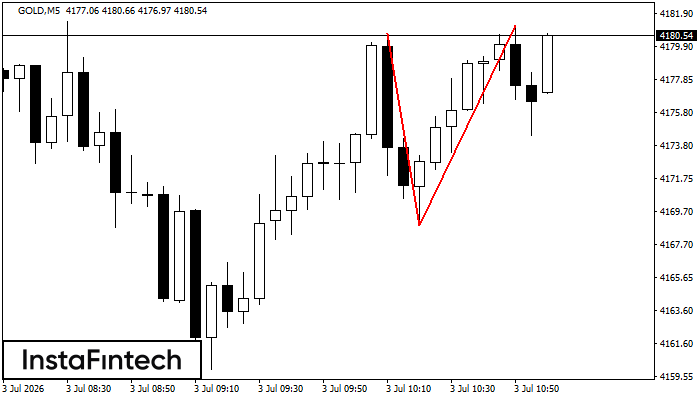
Double Top
The Double Top reversal pattern has been formed on GOLD M5. Characteristics: the upper boundary 4180.67; the lower boundary 4168.83; the width of the pattern is 1235 points. Sell trades are better to be opened below the lower boundary 4168.83 with a possible movements towards the 4168.68 level.
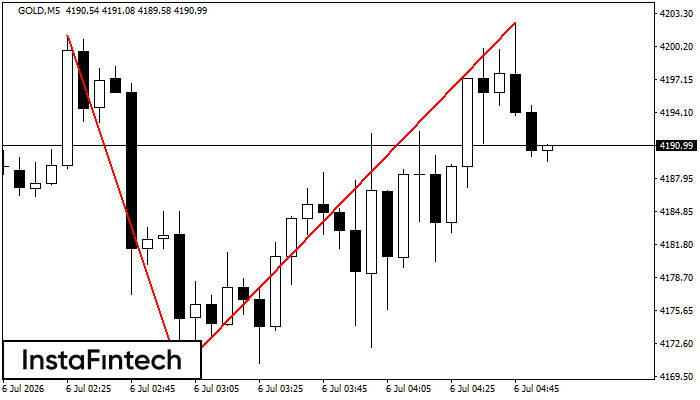
GOLD M5
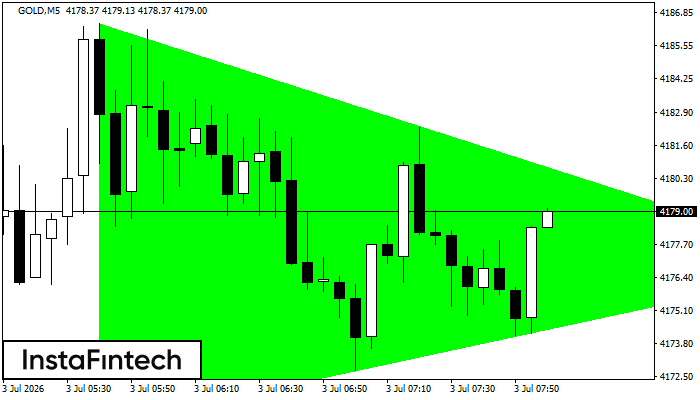
Bullish Symmetrical Triangle
According to the chart of M5, GOLD formed the Bullish Symmetrical Triangle pattern, which signals the trend will continue. Description. The upper border of the pattern touches the coordinates 4186.42/4176.91 whereas the lower border goes across 4170.54/4176.91. The pattern width is measured on the chart at 1588 pips. If the Bullish Symmetrical Triangle pattern is in progress during the upward trend, this indicates the current trend will go on. In case 4176.91 is broken, the price could continue its move toward 4177.06.
GOLD M5
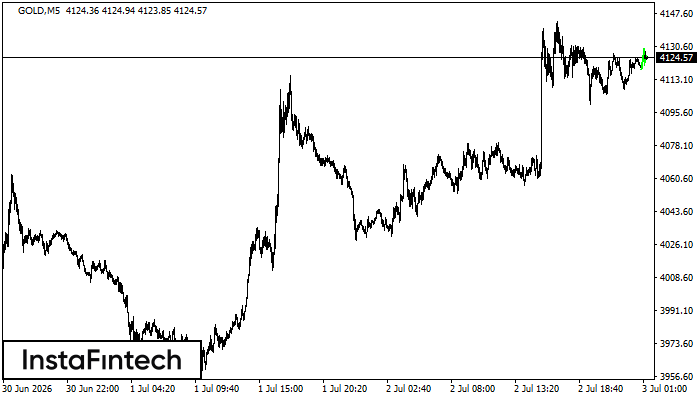
Bullish pennant
The Bullish pennant pattern is formed on the GOLD M5 chart. It is a type of the continuation pattern. Supposedly, in case the price is fixed above the pennant’s high of 4129.14, a further uptrend is possible.
GOLD M5
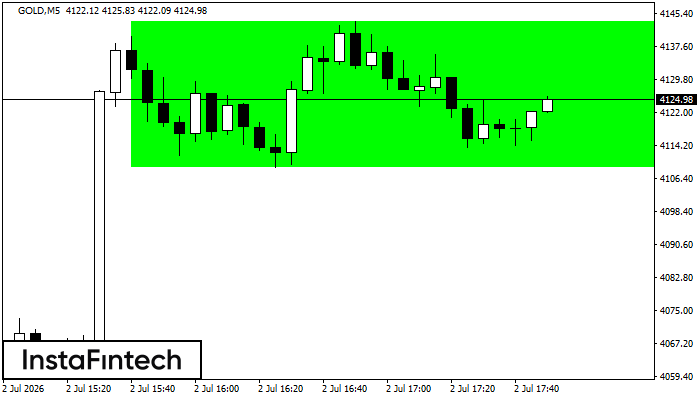
Bullish Rectangle
According to the chart of M5, GOLD formed the Bullish Rectangle. This type of a pattern indicates a trend continuation. It consists of two levels: resistance 4143.54 and support 4108.90. In case the resistance level 4143.54 - 4143.54 is broken, the instrument is likely to follow the bullish trend.
GOLD M15
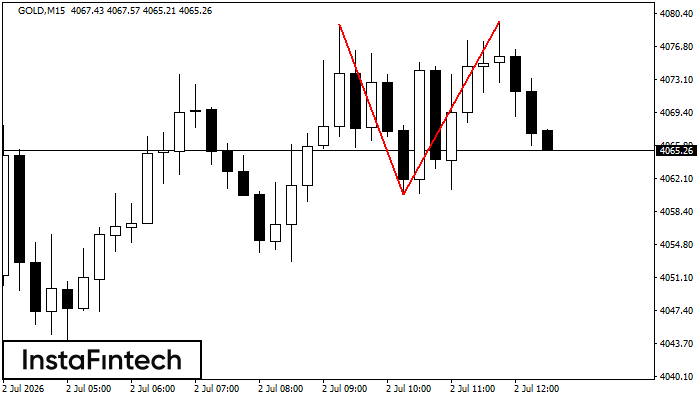
Double Top
The Double Top reversal pattern has been formed on GOLD M15. Characteristics: the upper boundary 4079.27; the lower boundary 4060.32; the width of the pattern is 1920 points. Sell trades are better to be opened below the lower boundary 4060.32 with a possible movements towards the 4060.09 level.