 English
  Русский
 Bahasa Indonesia
 Bahasa Malay
 ไทย
ไทย Español
 Deutsch
 Български
 Français
 Tiếng Việt
 中文
中文 বাংলা
বাংলা हिन्दी
 Čeština
 Українська
 Română
FX.co ★ Patterns #MSFT | Microsoft Corporation Stock Price

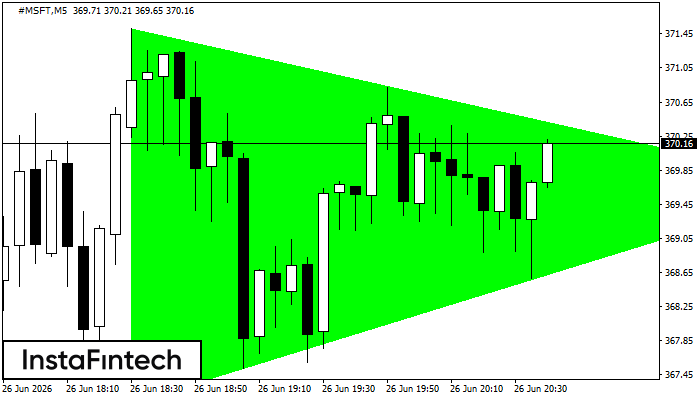
#MSFT M5
Bullish Symmetrical Triangle
According to the chart of M5, #MSFT formed the Bullish Symmetrical Triangle pattern. Description: This is the pattern of a trend continuation. 371.51 and 367.11 are the coordinates of the upper and lower borders respectively. The pattern width is measured on the chart at 440 pips. Outlook: If the upper border 371.51 is broken, the price is likely to continue its move by 369.81.
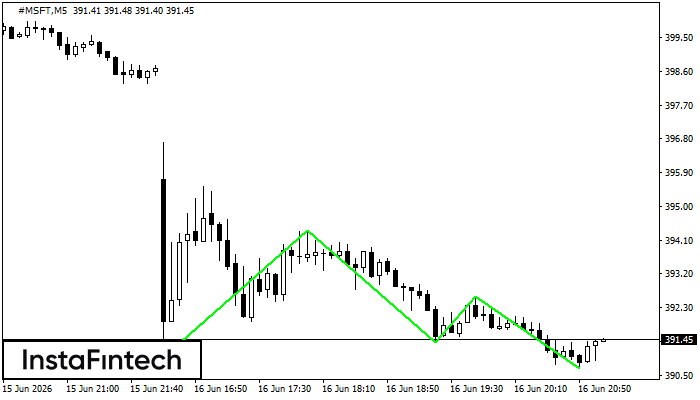
#MSFT M5
Triple Bottom
The Triple Bottom pattern has been formed on #MSFT M5. It has the following characteristics: resistance level 394.35/392.59; support level 390.96/390.68; the width is 339 points. In the event of a breakdown of the resistance level of 394.35, the price is likely to continue an upward movement at least to 391.53.
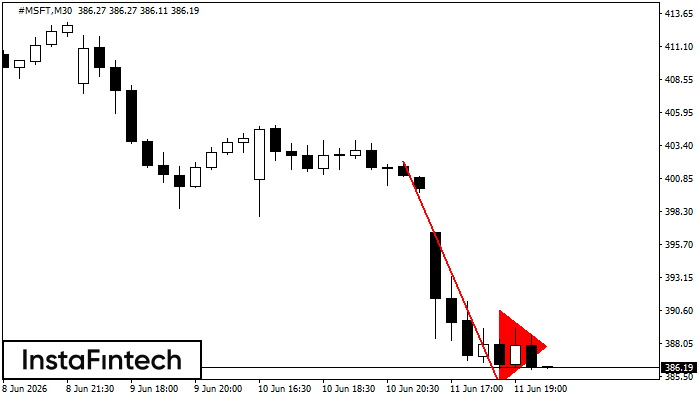
#MSFT M30
Bearish pennant
The Bearish pennant pattern has formed on the #MSFT M30 chart. It signals potential continuation of the existing trend. Specifications: the pattern’s bottom has the coordinate of 384.84; the projection of the flagpole height is equal to 1732 pips. In case the price breaks out the pattern’s bottom of 384.84, the downtrend is expected to continue for further level 384.54.
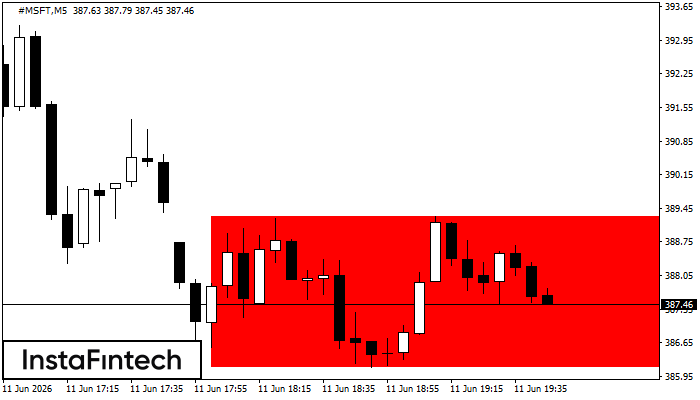
#MSFT M5
Bearish Rectangle
According to the chart of M5, #MSFT formed the Bearish Rectangle which is a pattern of a trend continuation. The pattern is contained within the following borders: lower border 386.13 – 386.13 and upper border 389.27 – 389.27. In case the lower border is broken, the instrument is likely to follow the downward trend.
#MSFT M5
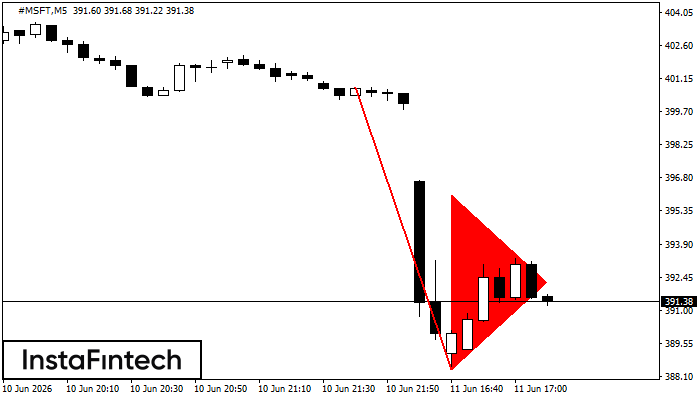
Bearish pennant
The Bearish pennant pattern has formed on the #MSFT M5 chart. The pattern signals continuation of the downtrend in case the pennant’s low of 388.42 is broken through. Recommendations: Place the sell stop pending order 10 pips below the pattern’s low. Place the take profit order at the projection distance of the flagpole height.
#MSFT M15
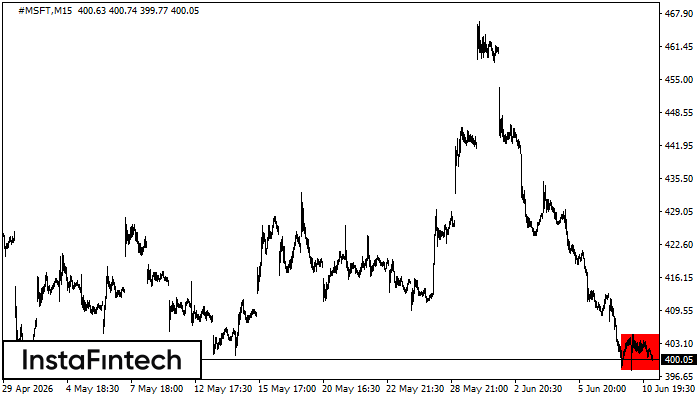
Bearish Rectangle
According to the chart of M15, #MSFT formed the Bearish Rectangle. The pattern indicates a trend continuation. The upper border is 405.00, the lower border is 397.92. The signal means that a short position should be opened after fixing a price below the lower border 397.92 of the Bearish Rectangle.
#MSFT M5
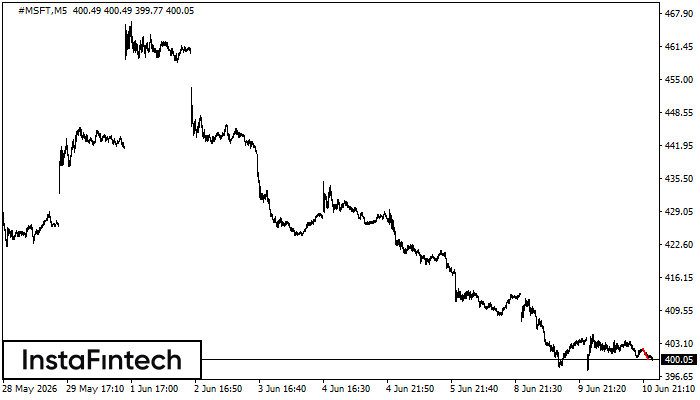
Bearish pennant
The Bearish pennant pattern has formed on the #MSFT M5 chart. This pattern type is characterized by a slight slowdown after which the price will move in the direction of the original trend. In case the price fixes below the pattern’s low of 400.10, a trader will be able to successfully enter the sell position.
#MSFT M5
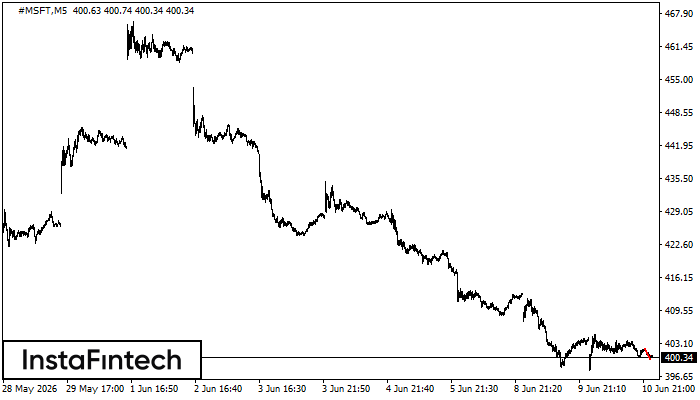
Bearish pennant
The Bearish pennant pattern has formed on the #MSFT M5 chart. It signals potential continuation of the existing trend. Specifications: the pattern’s bottom has the coordinate of 400.10; the projection of the flagpole height is equal to 206 pips. In case the price breaks out the pattern’s bottom of 400.10, the downtrend is expected to continue for further level 399.95.
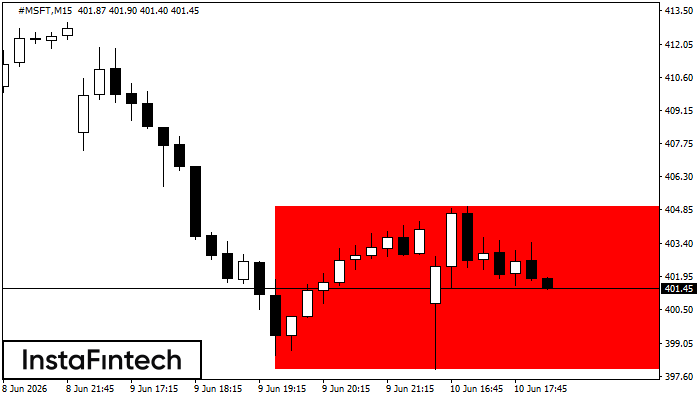
#MSFT M15
Bearish Rectangle
According to the chart of M15, #MSFT formed the Bearish Rectangle which is a pattern of a trend continuation. The pattern is contained within the following borders: lower border 397.92 – 397.92 and upper border 405.00 – 405.00. In case the lower border is broken, the instrument is likely to follow the downward trend.
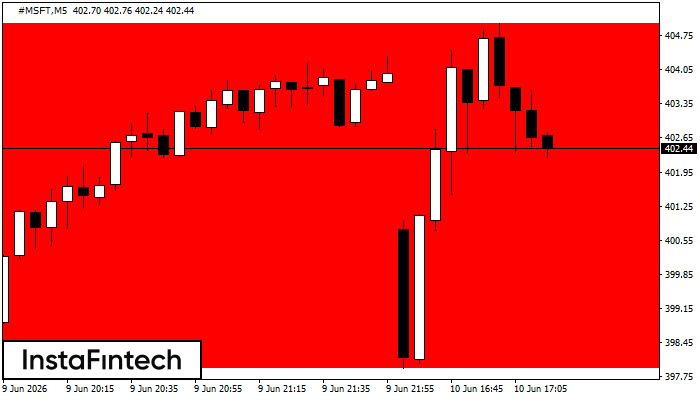
#MSFT M5
Bearish Rectangle
According to the chart of M5, #MSFT formed the Bearish Rectangle. The pattern indicates a trend continuation. The upper border is 405.00, the lower border is 397.92. The signal means that a short position should be opened after fixing a price below the lower border 397.92 of the Bearish Rectangle.