 English
  Русский
 Bahasa Indonesia
 Bahasa Malay
 ไทย
ไทย Español
 Deutsch
 Български
 Français
 Tiếng Việt
 中文
中文 বাংলা
বাংলা हिन्दी
 Čeština
 Українська
 Română
FX.co ★ Patterns NZDCAD | New Zealand Dollar (NZD) to Canadian Dollar (CAD) Rate in the Forex market


NZDCAD M15
Bearish Flag
The Bearish Flag pattern has been formed on the chart NZDCAD M15. Therefore, the downwards trend is likely to continue in the nearest term. As soon as the price breaks below the low at 0.8069, traders should enter the market.
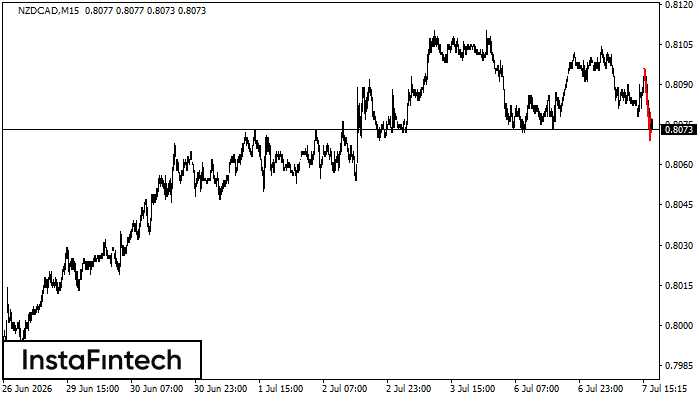
NZDCAD M15
Bearish pennant
The Bearish pennant pattern has formed on the NZDCAD M15 chart. This pattern type is characterized by a slight slowdown after which the price will move in the direction of the original trend. In case the price fixes below the pattern’s low of 0.8069, a trader will be able to successfully enter the sell position.
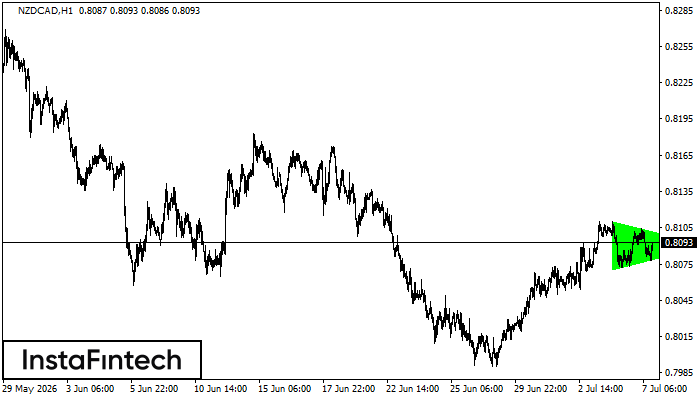
NZDCAD H1
Bullish Symmetrical Triangle
According to the chart of H1, NZDCAD formed the Bullish Symmetrical Triangle pattern. The lower border of the pattern touches the coordinates 0.8070/0.8090 whereas the upper border goes across 0.8110/0.8090. If the Bullish Symmetrical Triangle pattern is in progress, this evidently signals a further upward trend. In other words, in case the scenario comes true, the price of NZDCAD will breach the upper border to head for 0.8130.
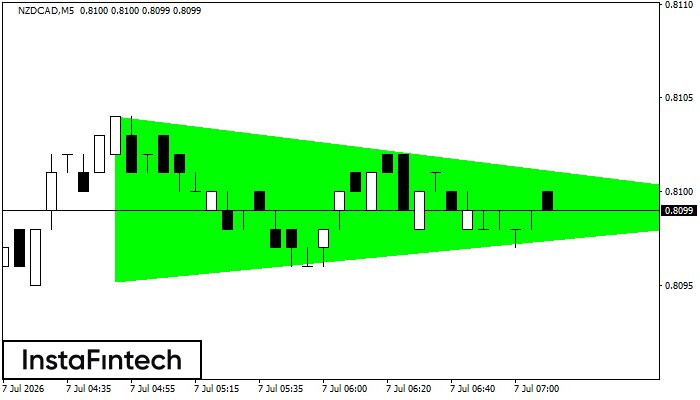
NZDCAD M5
Bullish Symmetrical Triangle
According to the chart of M5, NZDCAD formed the Bullish Symmetrical Triangle pattern, which signals the trend will continue. Description. The upper border of the pattern touches the coordinates 0.8104/0.8099 whereas the lower border goes across 0.8095/0.8099. The pattern width is measured on the chart at 9 pips. If the Bullish Symmetrical Triangle pattern is in progress during the upward trend, this indicates the current trend will go on. In case 0.8099 is broken, the price could continue its move toward 0.8114.
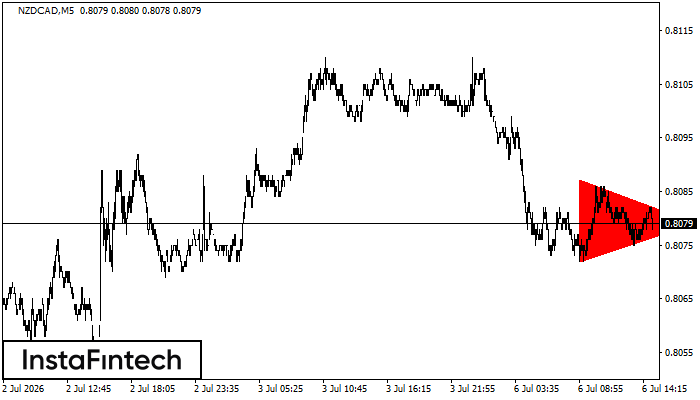
NZDCAD M5
Bearish Symmetrical Triangle
According to the chart of M5, NZDCAD formed the Bearish Symmetrical Triangle pattern. Trading recommendations: A breach of the lower border 0.8072 is likely to encourage a continuation of the downward trend.
NZDCAD M5
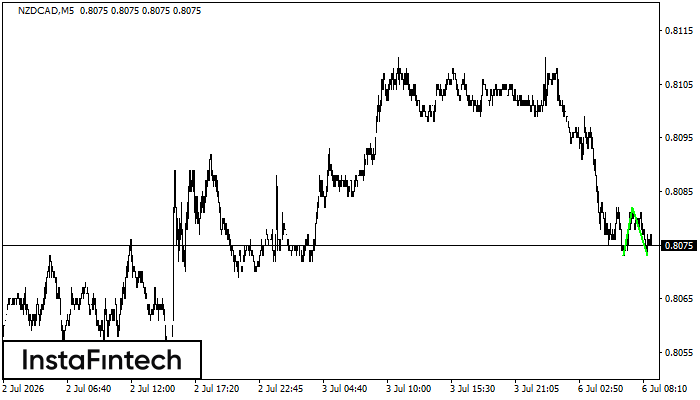
Double Bottom
The Double Bottom pattern has been formed on NZDCAD M5. Characteristics: the support level 0.8073; the resistance level 0.8082; the width of the pattern 9 points. If the resistance level is broken, a change in the trend can be predicted with the first target point lying at the distance of 9 points.
NZDCAD H1
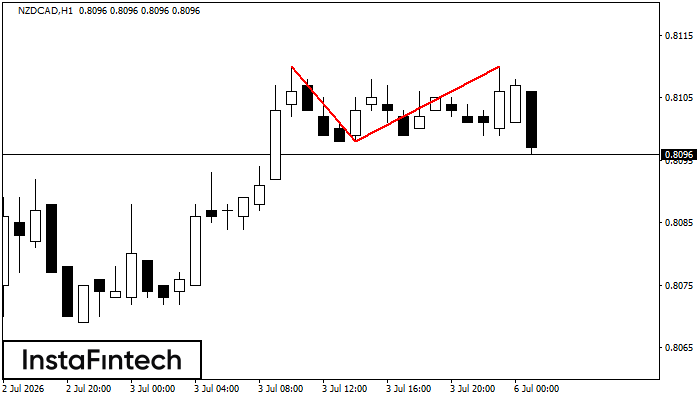
Double Top
On the chart of NZDCAD H1 the Double Top reversal pattern has been formed. Characteristics: the upper boundary 0.8110; the lower boundary 0.8098; the width of the pattern 12 points. The signal: a break of the lower boundary will cause continuation of the downward trend targeting the 0.8058 level.
NZDCAD M5
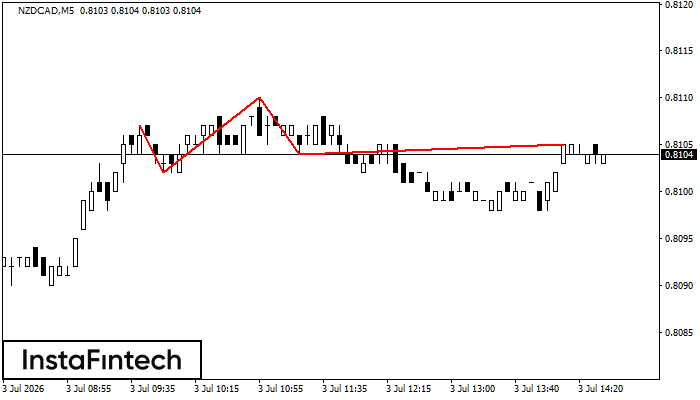
Head and Shoulders
According to the chart of M5, NZDCAD formed the Head and Shoulders pattern. The Head’s top is set at 0.8110 while the median line of the Neck is found at 0.8102/0.8104. The formation of the Head and Shoulders pattern evidently signals a reversal of the upward trend. In other words, in case the scenario comes true, the price of NZDCAD will go towards 0.8089.
NZDCAD H1
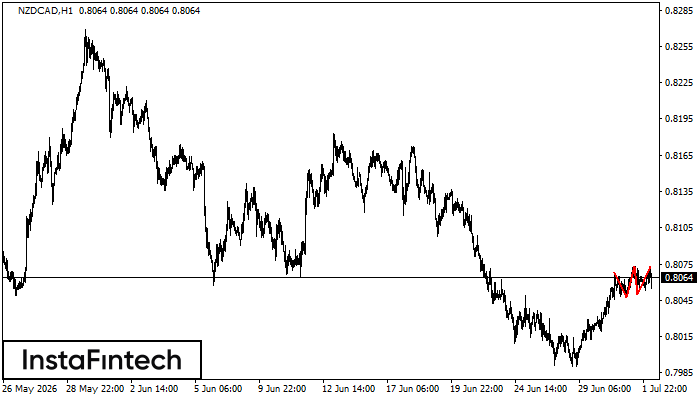
Triple Top
The Triple Top pattern has formed on the chart of the NZDCAD H1. Features of the pattern: borders have an ascending angle; the lower line of the pattern has the coordinates 0.8047/0.8050 with the upper limit 0.8068/0.8073; the projection of the width is 21 points. The formation of the Triple Top figure most likely indicates a change in the trend from upward to downward. This means that in the event of a breakdown of the support level of 0.8047, the price is most likely to continue the downward movement.
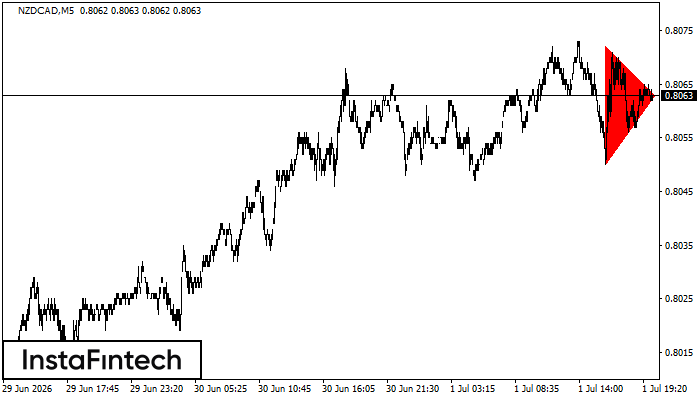
NZDCAD M5
Bearish Symmetrical Triangle
According to the chart of M5, NZDCAD formed the Bearish Symmetrical Triangle pattern. Trading recommendations: A breach of the lower border 0.8050 is likely to encourage a continuation of the downward trend.