 English
  Русский
 Bahasa Indonesia
 Bahasa Malay
 ไทย
ไทย Español
 Deutsch
 Български
 Français
 Tiếng Việt
 中文
中文 বাংলা
বাংলা हिन्दी
 Čeština
 Українська
 Română
FX.co ★ Patterns #TSLA | Tesla, Inc. Stock Price

#TSLA M5
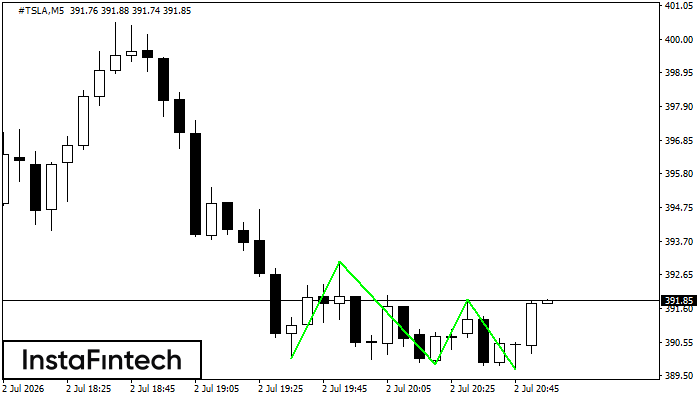
Triple Bottom
The Triple Bottom pattern has been formed on #TSLA M5. It has the following characteristics: resistance level 393.06/391.87; support level 390.04/389.70; the width is 302 points. In the event of a breakdown of the resistance level of 393.06, the price is likely to continue an upward movement at least to 390.00.
#TSLA M5
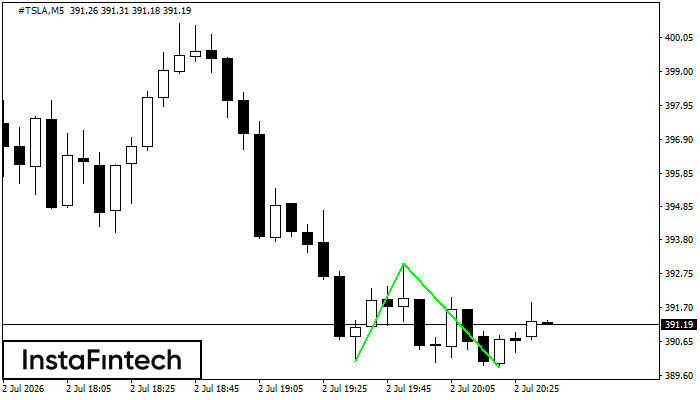
Double Bottom
The Double Bottom pattern has been formed on #TSLA M5. Characteristics: the support level 390.04; the resistance level 393.06; the width of the pattern 302 points. If the resistance level is broken, a change in the trend can be predicted with the first target point lying at the distance of 321 points.
#TSLA M5
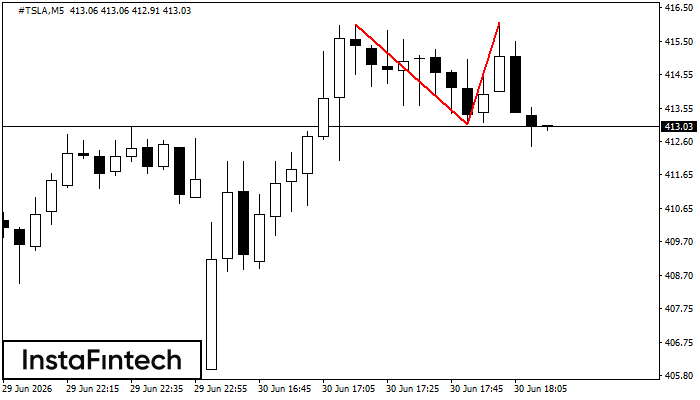
Double Top
The Double Top pattern has been formed on #TSLA M5. It signals that the trend has been changed from upwards to downwards. Probably, if the base of the pattern 413.10 is broken, the downward movement will continue.
#TSLA M5
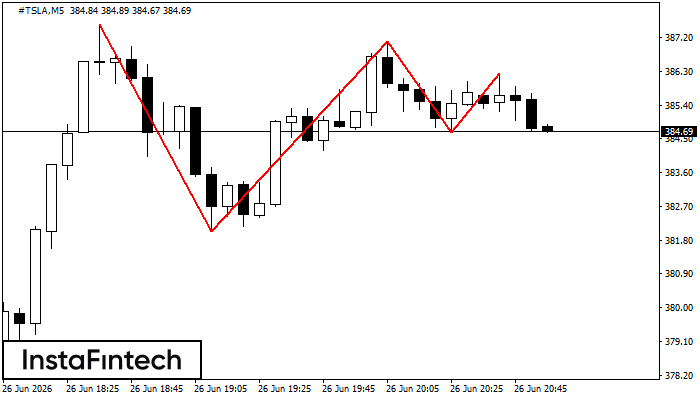
Triple Top
The Triple Top pattern has formed on the chart of the #TSLA M5. Features of the pattern: borders have an ascending angle; the lower line of the pattern has the coordinates 382.04/384.66 with the upper limit 387.55/386.26; the projection of the width is 551 points. The formation of the Triple Top figure most likely indicates a change in the trend from upward to downward. This means that in the event of a breakdown of the support level of 382.04, the price is most likely to continue the downward movement.
#TSLA M5
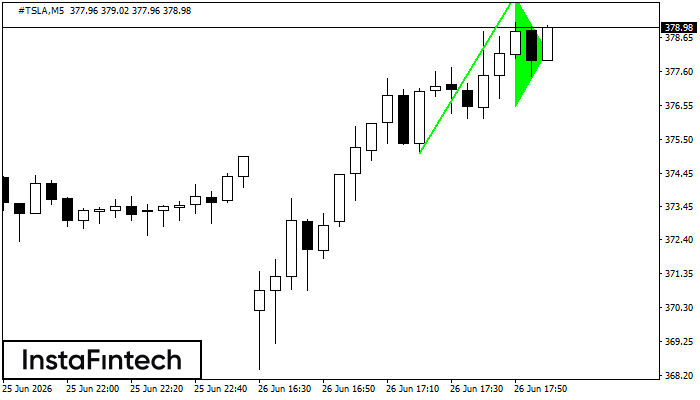
Bullish pennant
The Bullish pennant graphic pattern has formed on the #TSLA M5 instrument. This pattern type falls under the category of continuation patterns. In this case, if the quote can breaks out high, is expected to continue the upward trend to level 380.07.
#TSLA M5
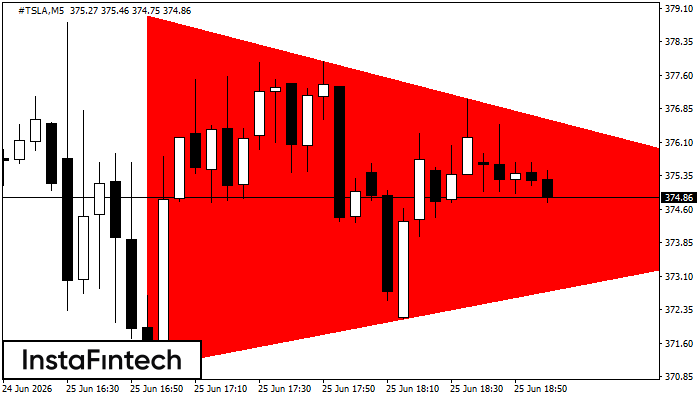
Bearish Symmetrical Triangle
According to the chart of M5, #TSLA formed the Bearish Symmetrical Triangle pattern. This pattern signals a further downward trend in case the lower border 371.06 is breached. Here, a hypothetical profit will equal the width of the available pattern that is -788 pips.
#TSLA M5
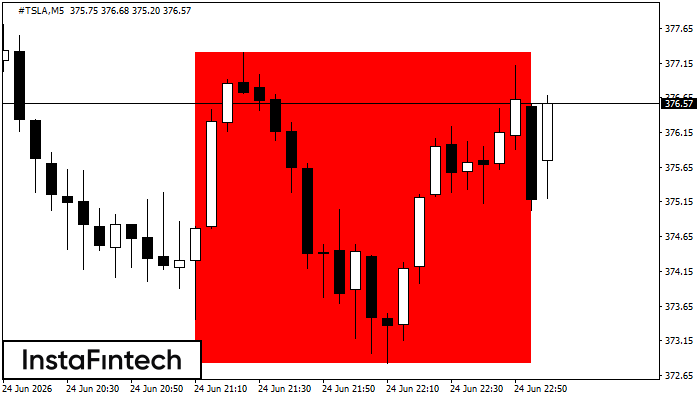
Bearish Rectangle
According to the chart of M5, #TSLA formed the Bearish Rectangle. This type of a pattern indicates a trend continuation. It consists of two levels: resistance 377.30 - 0.00 and support 372.82 – 372.82. In case the resistance level 372.82 - 372.82 is broken, the instrument is likely to follow the bearish trend.
#TSLA M5
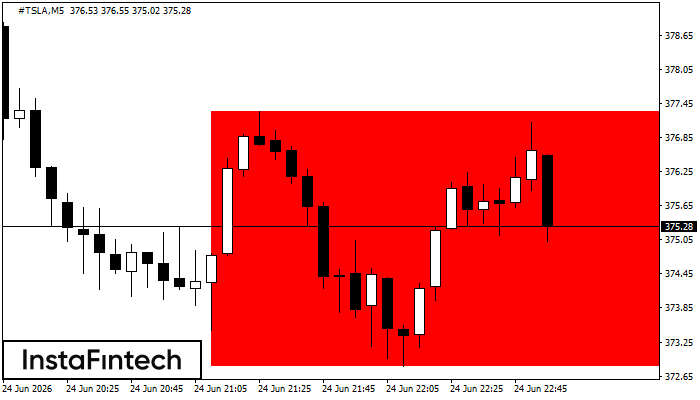
Bearish Rectangle
According to the chart of M5, #TSLA formed the Bearish Rectangle which is a pattern of a trend continuation. The pattern is contained within the following borders: lower border 372.82 – 372.82 and upper border 377.30 – 377.30. In case the lower border is broken, the instrument is likely to follow the downward trend.
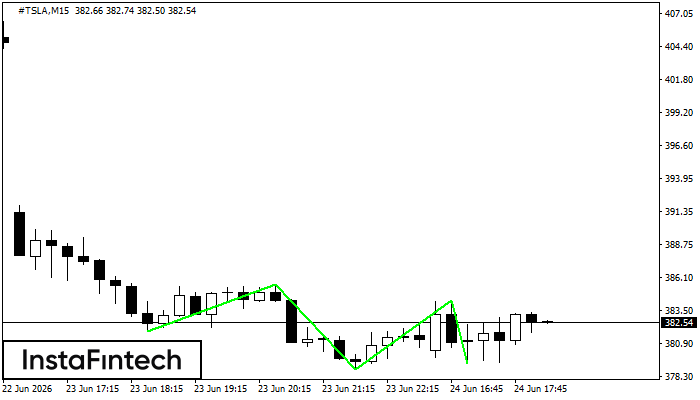
#TSLA M15
Triple Bottom
The Triple Bottom pattern has been formed on #TSLA M15. It has the following characteristics: resistance level 385.55/384.29; support level 381.84/379.31; the width is 371 points. In the event of a breakdown of the resistance level of 385.55, the price is likely to continue an upward movement at least to 379.05.
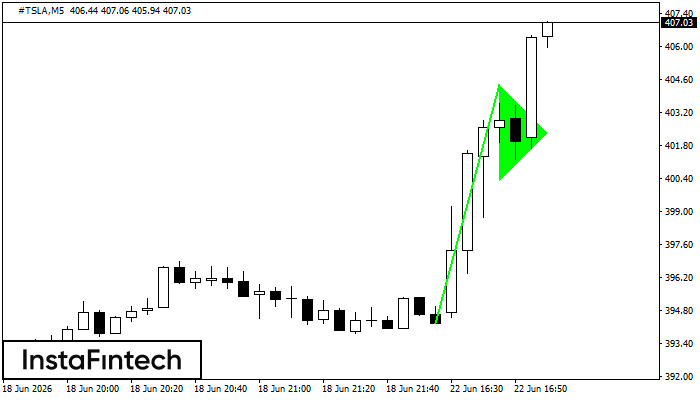
#TSLA M5
Bullish pennant
The Bullish pennant signal – Trading instrument #TSLA M5, continuation pattern. Forecast: it is possible to set up a buy position above the pattern’s high of 404.40, with the prospect of the next move being a projection of the flagpole height.