 English
  Русский
 Bahasa Indonesia
 Bahasa Malay
 ไทย
ไทย Español
 Deutsch
 Български
 Français
 Tiếng Việt
 中文
中文 বাংলা
বাংলা हिन्दी
 Čeština
 Українська
 Română
FX.co ★ Patterns USDJPY | US Dollar (USD) to Japanese Yen (JPY) Rate in the Forex market

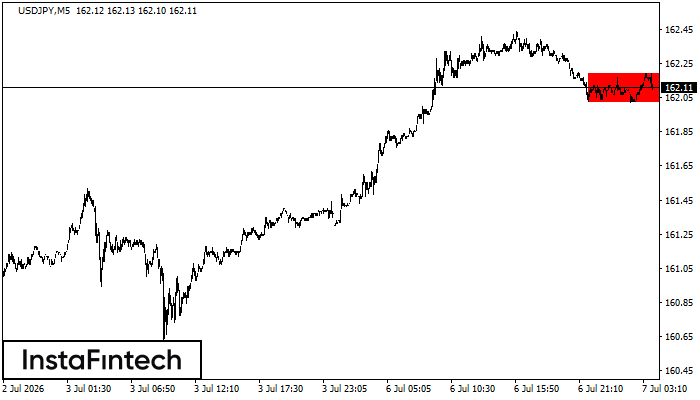
USDJPY M5
Bearish Rectangle
According to the chart of M5, USDJPY formed the Bearish Rectangle which is a pattern of a trend continuation. The pattern is contained within the following borders: lower border 162.02 – 162.02 and upper border 162.19 – 162.19. In case the lower border is broken, the instrument is likely to follow the downward trend.
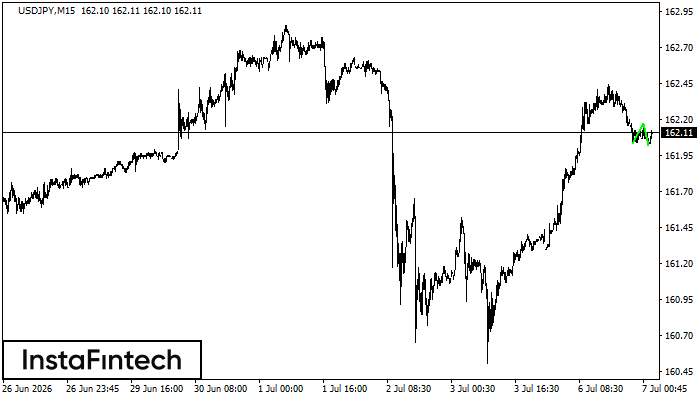
USDJPY M15
Double Bottom
The Double Bottom pattern has been formed on USDJPY M15; the upper boundary is 162.17; the lower boundary is 162.02. The width of the pattern is 14 points. In case of a break of the upper boundary 162.17, a change in the trend can be predicted where the width of the pattern will coincide with the distance to a possible take profit level.
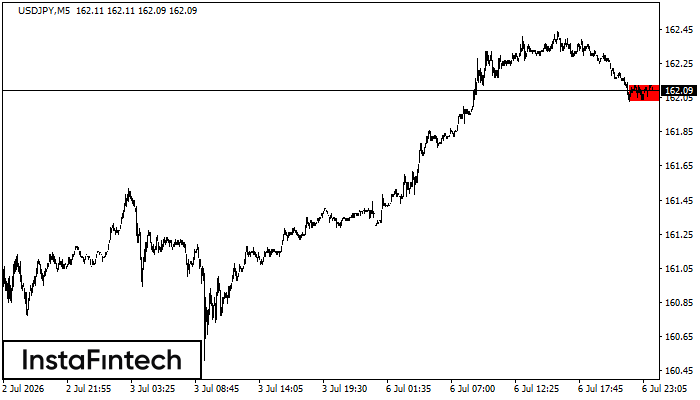
USDJPY M5
Bearish Rectangle
According to the chart of M5, USDJPY formed the Bearish Rectangle. The pattern indicates a trend continuation. The upper border is 162.12, the lower border is 162.03. The signal means that a short position should be opened after fixing a price below the lower border 162.03 of the Bearish Rectangle.
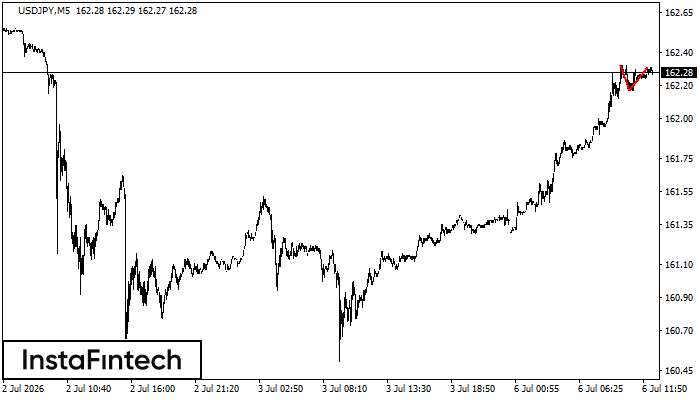
USDJPY M5
Double Top
On the chart of USDJPY M5 the Double Top reversal pattern has been formed. Characteristics: the upper boundary 162.31; the lower boundary 162.17; the width of the pattern 14 points. The signal: a break of the lower boundary will cause continuation of the downward trend targeting the 162.02 level.
USDJPY M5
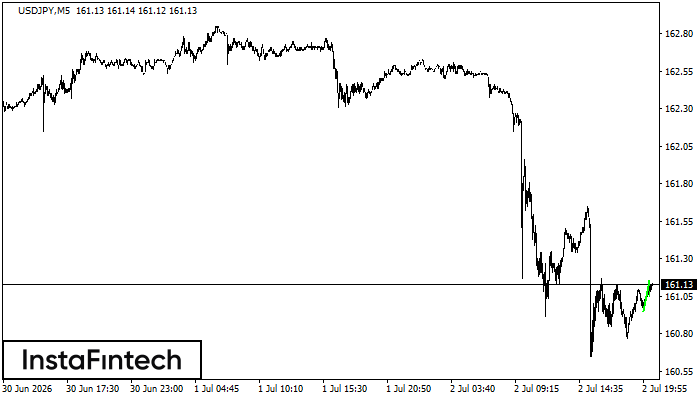
Bullish pennant
The Bullish pennant signal – Trading instrument USDJPY M5, continuation pattern. Forecast: it is possible to set up a buy position above the pattern’s high of 161.16, with the prospect of the next move being a projection of the flagpole height.
USDJPY M5
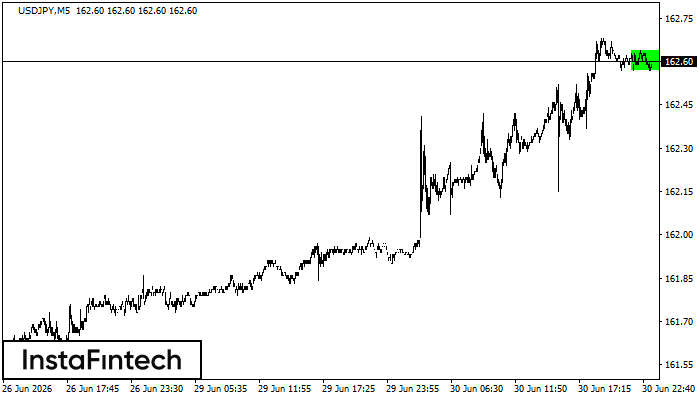
Bullish Rectangle
According to the chart of M5, USDJPY formed the Bullish Rectangle. The pattern indicates a trend continuation. The upper border is 162.64, the lower border is 162.57. The signal means that a long position should be opened above the upper border 162.64 of the Bullish Rectangle.
USDJPY M5
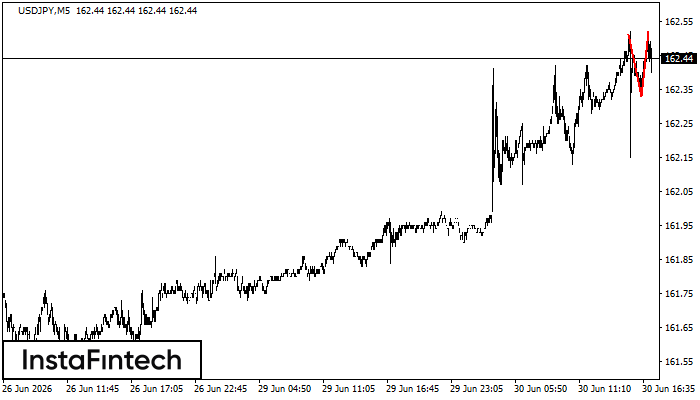
Double Top
On the chart of USDJPY M5 the Double Top reversal pattern has been formed. Characteristics: the upper boundary 162.52; the lower boundary 162.33; the width of the pattern 19 points. The signal: a break of the lower boundary will cause continuation of the downward trend targeting the 162.18 level.

USDJPY M5
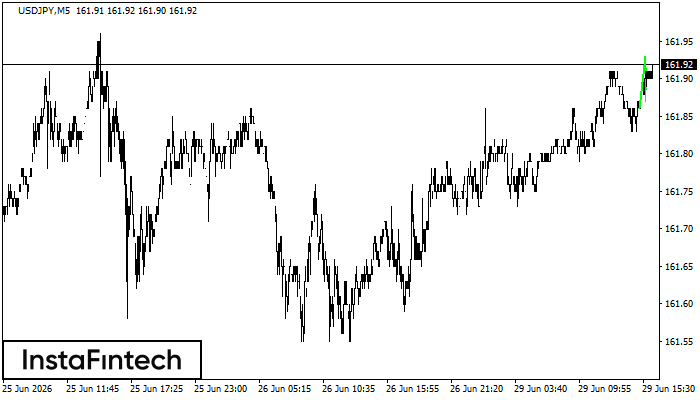
Bullish Flag
The Bullish Flag pattern has been formed on the chart USDJPY M5 which signals that the upward trend will continue. Signals: а break of the peak at 161.93 may push the price higher, and the rise will be the projection of the pole.
USDJPY M5
Bullish pennant
The Bullish pennant signal – Trading instrument USDJPY M5, continuation pattern. Forecast: it is possible to set up a buy position above the pattern’s high of 161.93, with the prospect of the next move being a projection of the flagpole height.
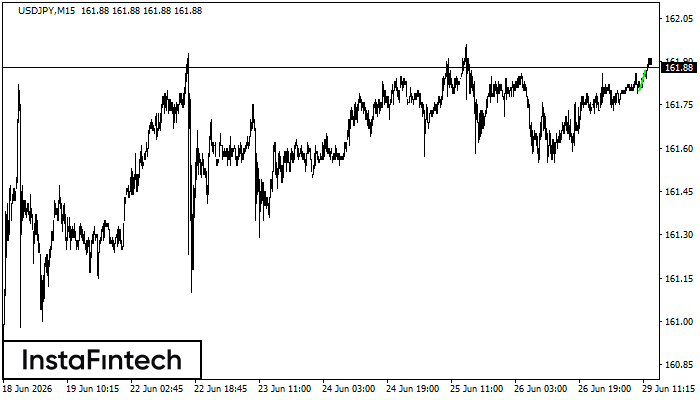
USDJPY M15
Bullish Flag
The Bullish Flag pattern has been formed on the chart USDJPY M15 which signals that the upward trend will continue. Signals: а break of the peak at 161.87 may push the price higher, and the rise will be the projection of the pole.