 Français
  Русский
 English
 Bahasa Indonesia
 Bahasa Malay
 ไทย
ไทย Español
 Deutsch
 Български
 Tiếng Việt
 中文
中文 বাংলা
বাংলা हिन्दी
 Čeština
 Українська
 Română
FX.co ★ Patterns #AAPL | Cours des actions d'Apple Inc.

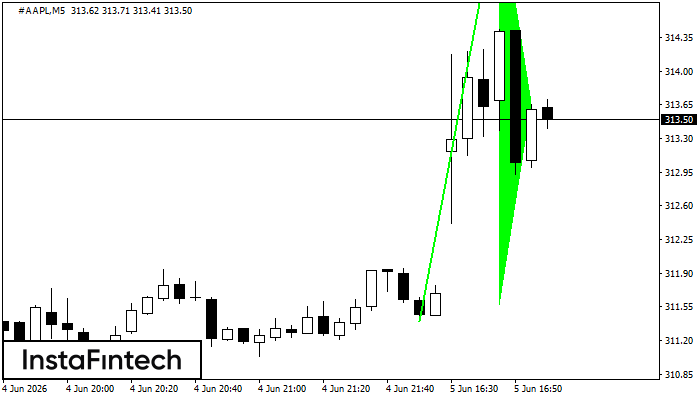
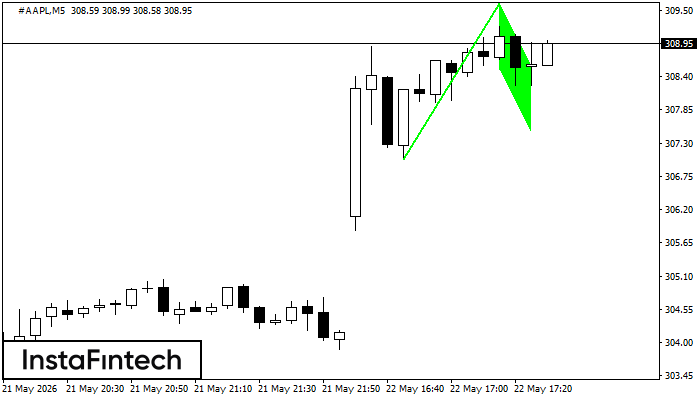
#AAPL M5
Bullish pennant
The Bullish pennant signal – Trading instrument #AAPL M5, continuation pattern. Forecast: it is possible to set up a buy position above the pattern’s high of 315.78, with the prospect of the next move being a projection of the flagpole height.
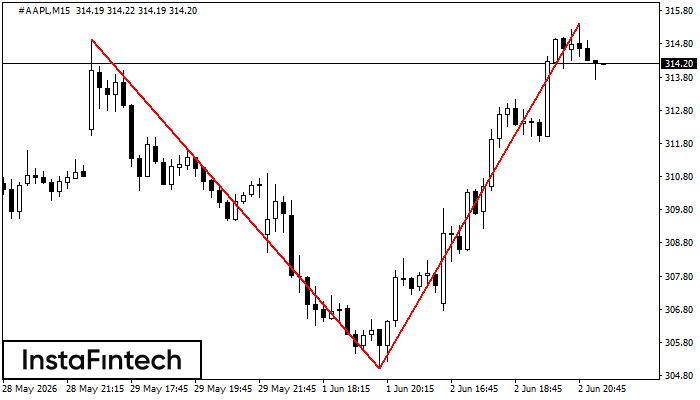
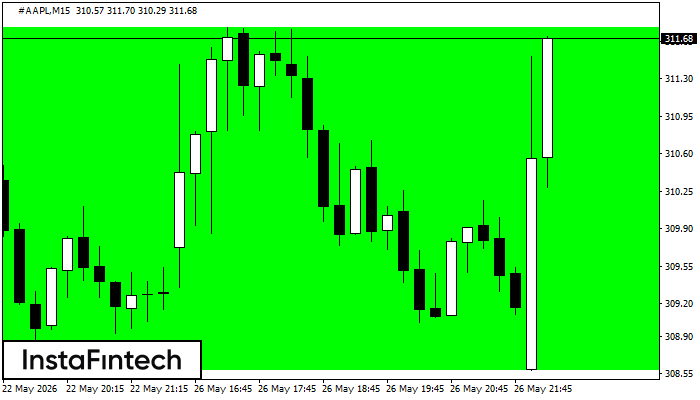
#AAPL M15
Double Top
The Double Top pattern has been formed on #AAPL M15. It signals that the trend has been changed from upwards to downwards. Probably, if the base of the pattern 305.02 is broken, the downward movement will continue.
#AAPL M5
Double Bottom
The Double Bottom pattern has been formed on #AAPL M5. Characteristics: the support level 310.39; the resistance level 311.97; the width of the pattern 158 points. If the resistance level is broken, a change in the trend can be predicted with the first target point lying at the distance of 156 points.
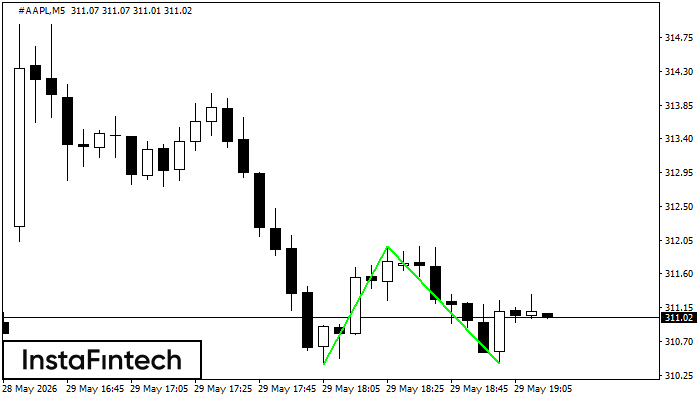
#AAPL M5
Double Bottom
The Double Bottom pattern has been formed on #AAPL M5. Characteristics: the support level 309.56; the resistance level 312.68; the width of the pattern 312 points. If the resistance level is broken, a change in the trend can be predicted with the first target point lying at the distance of 315 points.
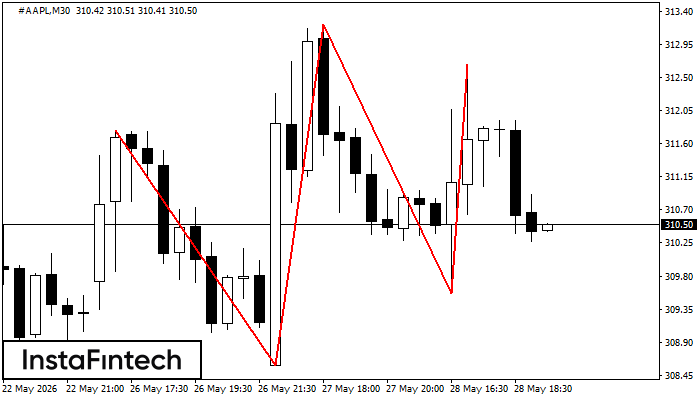
#AAPL M30
Triple Top
On the chart of the #AAPL M30 trading instrument, the Triple Top pattern that signals a trend change has formed. It is possible that after formation of the third peak, the price will try to break through the resistance level 308.58, where we advise to open a trading position for sale. Take profit is the projection of the pattern’s width, which is 320 points.
#AAPL M15
Bullish Rectangle
According to the chart of M15, #AAPL formed the Bullish Rectangle. This type of a pattern indicates a trend continuation. It consists of two levels: resistance 311.78 and support 308.58. In case the resistance level 311.78 - 311.78 is broken, the instrument is likely to follow the bullish trend.
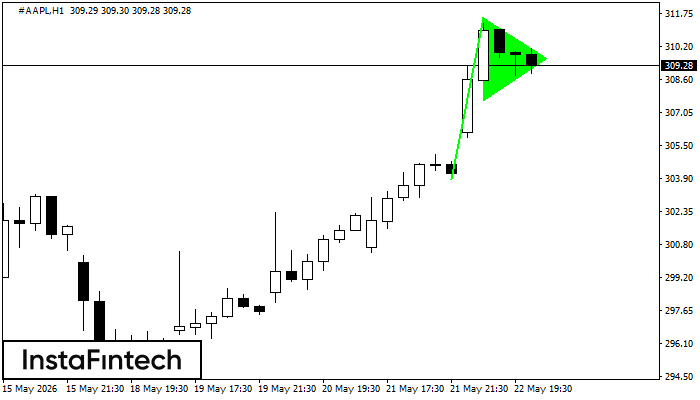
#AAPL H1
Bullish pennant
The Bullish pennant graphic pattern has formed on the #AAPL H1 instrument. This pattern type falls under the category of continuation patterns. In this case, if the quote can breaks out high, is expected to continue the upward trend to level 311.98.
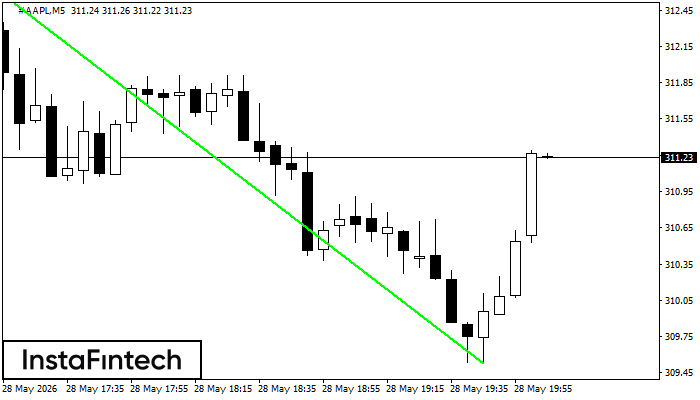
#AAPL M5
Bullish Flag
The Bullish Flag pattern has been formed on the chart #AAPL M5 which signals that the upward trend will continue. Signals: а break of the peak at 309.61 may push the price higher, and the rise will be the projection of the pole.
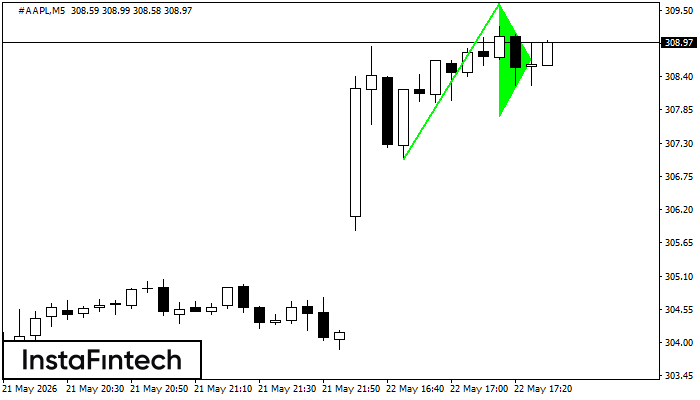
#AAPL M5
Bullish pennant
The Bullish pennant signal – Trading instrument #AAPL M5, continuation pattern. Forecast: it is possible to set up a buy position above the pattern’s high of 309.61, with the prospect of the next move being a projection of the flagpole height.
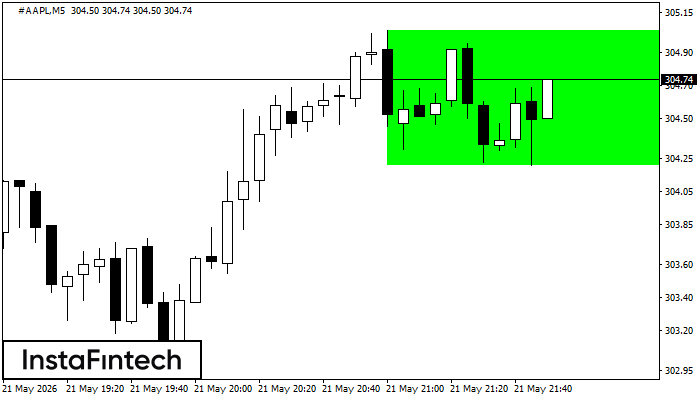
#AAPL M5
Bullish Rectangle
According to the chart of M5, #AAPL formed the Bullish Rectangle. This type of a pattern indicates a trend continuation. It consists of two levels: resistance 305.04 and support 304.21. In case the resistance level 305.04 - 305.04 is broken, the instrument is likely to follow the bullish trend.