 Français
  Русский
 English
 Bahasa Indonesia
 Bahasa Malay
 ไทย
ไทย Español
 Deutsch
 Български
 Tiếng Việt
 中文
中文 বাংলা
বাংলা हिन्दी
 Čeština
 Українська
 Română
FX.co ★ Patterns #AMZN | Cours des actions d'Amazon.com, Inc.

#AMZN M5
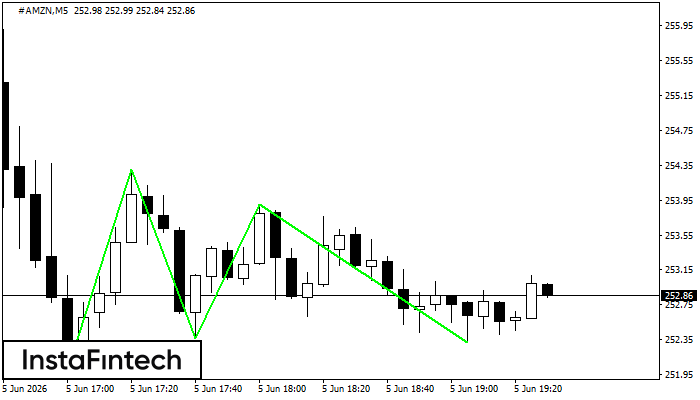
Triple Bottom
The Triple Bottom pattern has formed on the chart of #AMZN M5. Features of the pattern: The lower line of the pattern has coordinates 254.30 with the upper limit 254.30/253.90, the projection of the width is 230 points. The formation of the Triple Bottom pattern most likely indicates a change in the trend from downward to upward. This means that in the event of a breakdown of the resistance level 252.00, the price is most likely to continue the upward movement.
#AMZN M5
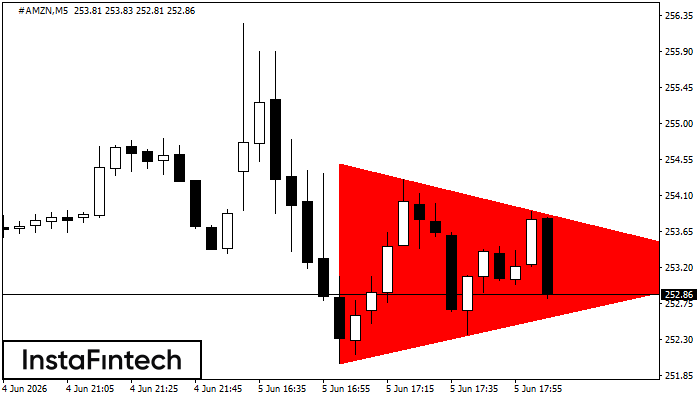
Bearish Symmetrical Triangle
According to the chart of M5, #AMZN formed the Bearish Symmetrical Triangle pattern. Description: The lower border is 252.00/253.18 and upper border is 254.50/253.18. The pattern width is measured on the chart at -250 pips. The formation of the Bearish Symmetrical Triangle pattern evidently signals a continuation of the downward trend. In other words, if the scenario comes true and #AMZN breaches the lower border, the price could continue its move toward 253.03.
#AMZN M5
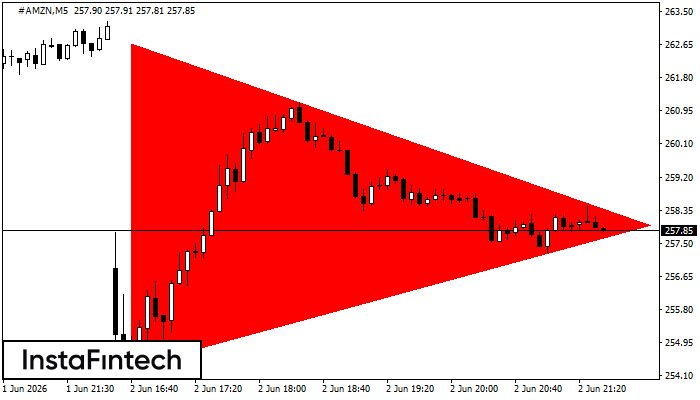
Bearish Symmetrical Triangle
According to the chart of M5, #AMZN formed the Bearish Symmetrical Triangle pattern. Description: The lower border is 254.32/257.96 and upper border is 262.68/257.96. The pattern width is measured on the chart at -836 pips. The formation of the Bearish Symmetrical Triangle pattern evidently signals a continuation of the downward trend. In other words, if the scenario comes true and #AMZN breaches the lower border, the price could continue its move toward 257.81.
#AMZN M5
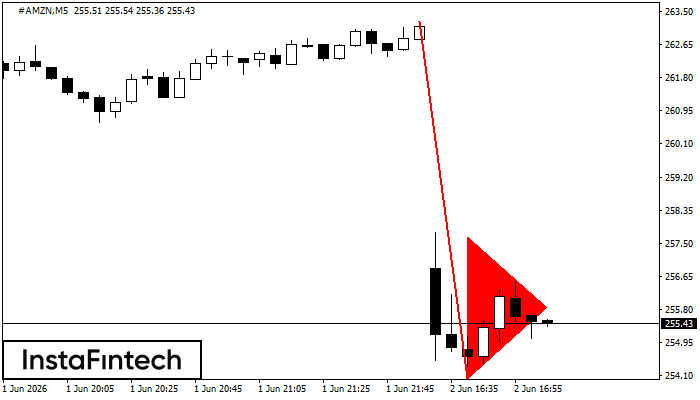
Bearish pennant
The Bearish pennant pattern has formed on the #AMZN M5 chart. This pattern type is characterized by a slight slowdown after which the price will move in the direction of the original trend. In case the price fixes below the pattern’s low of 254.02, a trader will be able to successfully enter the sell position.
#AMZN M5
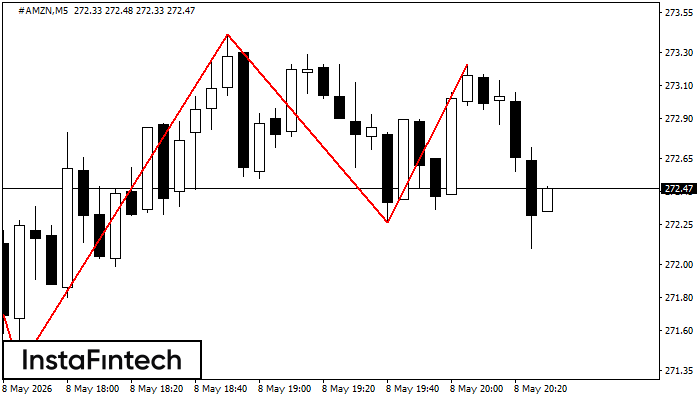
Triple Top
On the chart of the #AMZN M5 trading instrument, the Triple Top pattern that signals a trend change has formed. It is possible that after formation of the third peak, the price will try to break through the resistance level 271.37, where we advise to open a trading position for sale. Take profit is the projection of the pattern’s width, which is 194 points.
#AMZN M5
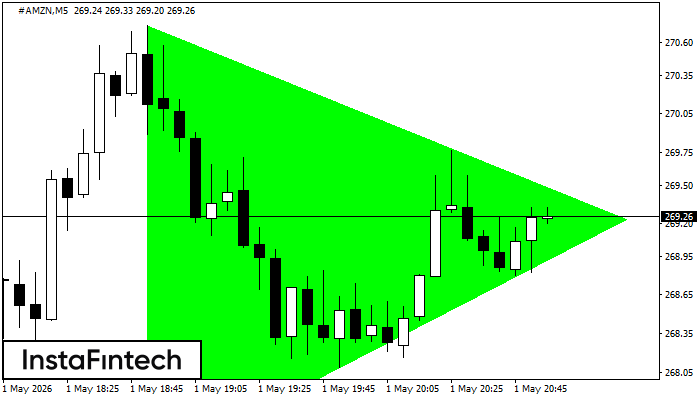
Bullish Symmetrical Triangle
According to the chart of M5, #AMZN formed the Bullish Symmetrical Triangle pattern, which signals the trend will continue. Description. The upper border of the pattern touches the coordinates 270.73/269.23 whereas the lower border goes across 267.32/269.23. The pattern width is measured on the chart at 341 pips. If the Bullish Symmetrical Triangle pattern is in progress during the upward trend, this indicates the current trend will go on. In case 269.23 is broken, the price could continue its move toward 269.38.
#AMZN M5
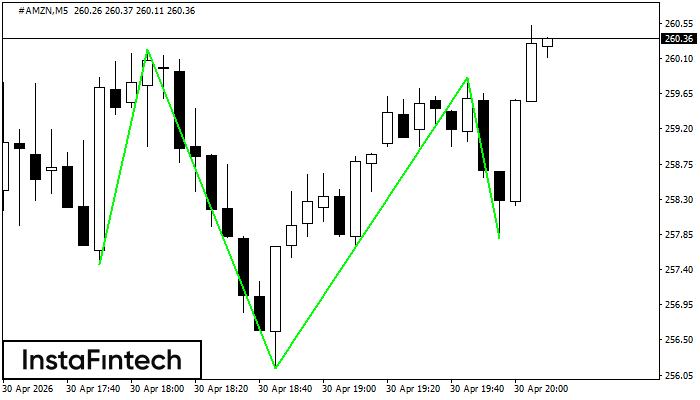
Inverse Head and Shoulder
According to the chart of M5, #AMZN formed the Inverse Head and Shoulder pattern. The Head’s top is set at 259.86 while the median line of the Neck is found at 256.13/257.80. The formation of the Inverse Head and Shoulder pattern evidently signals a reversal of the downward trend. In other words, in case the scenario comes true, the price of #AMZN will go towards 260.01
#AMZN M5
Double Bottom
The Double Bottom pattern has been formed on #AMZN M5; the upper boundary is 262.52; the lower boundary is 257.46. The width of the pattern is 508 points. In case of a break of the upper boundary 262.52, a change in the trend can be predicted where the width of the pattern will coincide with the distance to a possible take profit level.
#AMZN M15
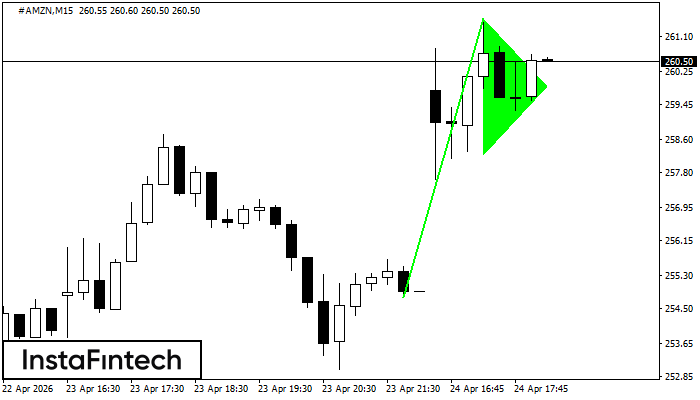
Bullish pennant
The Bullish pennant graphic pattern has formed on the #AMZN M15 instrument. This pattern type falls under the category of continuation patterns. In this case, if the quote can breaks out high, is expected to continue the upward trend to level 261.77.
#AMZN M5
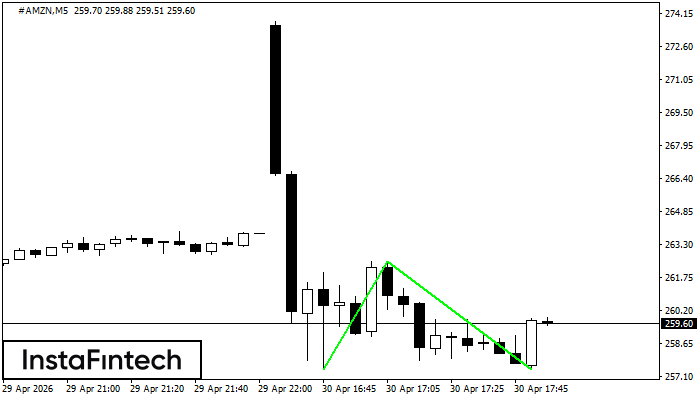
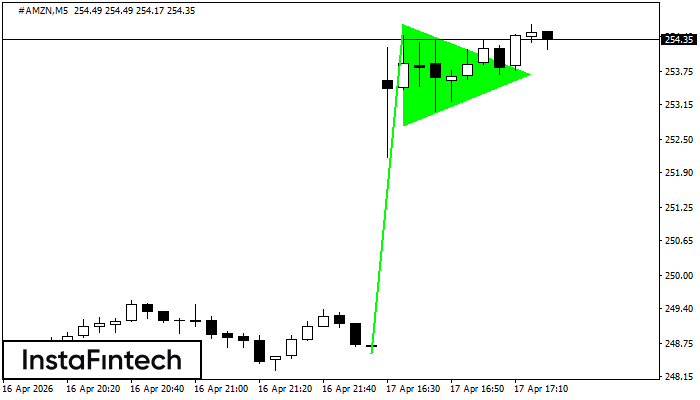
Bullish pennant
The Bullish pennant graphic pattern has formed on the #AMZN M5 instrument. This pattern type falls under the category of continuation patterns. In this case, if the quote can breaks out high, is expected to continue the upward trend to level 254.78.