 Français
  Русский
 English
 Bahasa Indonesia
 Bahasa Malay
 ไทย
ไทย Español
 Deutsch
 Български
 Tiếng Việt
 中文
中文 বাংলা
বাংলা हिन्दी
 Čeština
 Українська
 Română
FX.co ★ Patterns AUDUSD | Australian Dollar (AUD) to US Dollar (USD) Rate in the Forex market

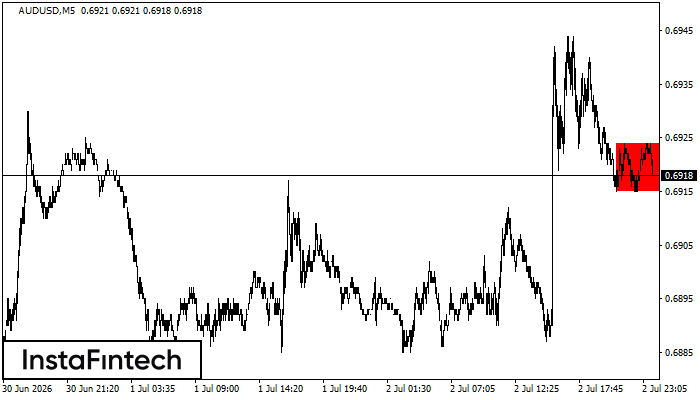
AUDUSD M5
Bearish Rectangle
According to the chart of M5, AUDUSD formed the Bearish Rectangle. This type of a pattern indicates a trend continuation. It consists of two levels: resistance 0.6924 - 0.0000 and support 0.6915 – 0.6915. In case the resistance level 0.6915 - 0.6915 is broken, the instrument is likely to follow the bearish trend.
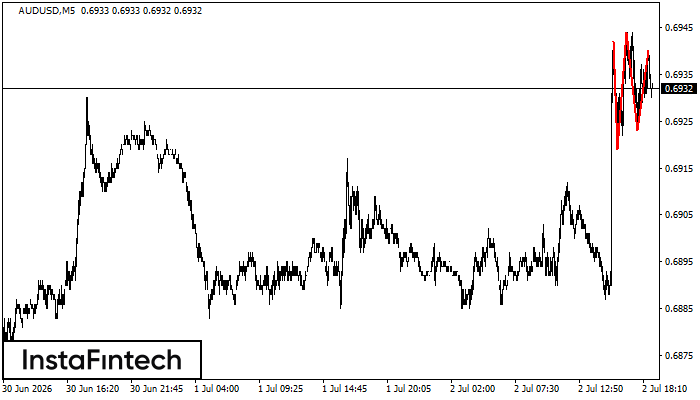
AUDUSD M5
Triple Top
The Triple Top pattern has formed on the chart of the AUDUSD M5. Features of the pattern: borders have an ascending angle; the lower line of the pattern has the coordinates 0.6919/0.6923 with the upper limit 0.6942/0.6940; the projection of the width is 23 points. The formation of the Triple Top figure most likely indicates a change in the trend from upward to downward. This means that in the event of a breakdown of the support level of 0.6919, the price is most likely to continue the downward movement.
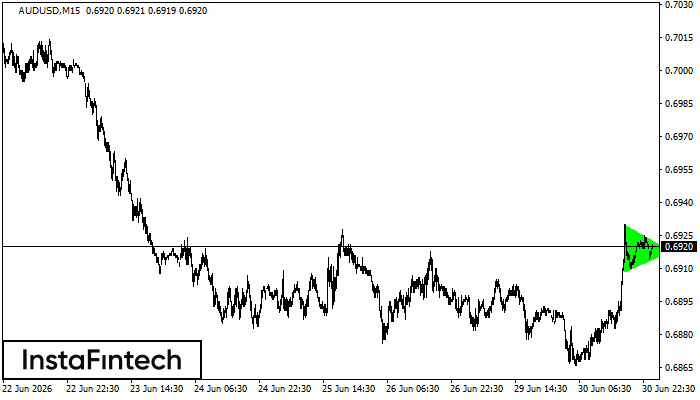
AUDUSD M15
Bullish Symmetrical Triangle
According to the chart of M15, AUDUSD formed the Bullish Symmetrical Triangle pattern. The lower border of the pattern touches the coordinates 0.6909/0.6918 whereas the upper border goes across 0.6930/0.6918. If the Bullish Symmetrical Triangle pattern is in progress, this evidently signals a further upward trend. In other words, in case the scenario comes true, the price of AUDUSD will breach the upper border to head for 0.6941.
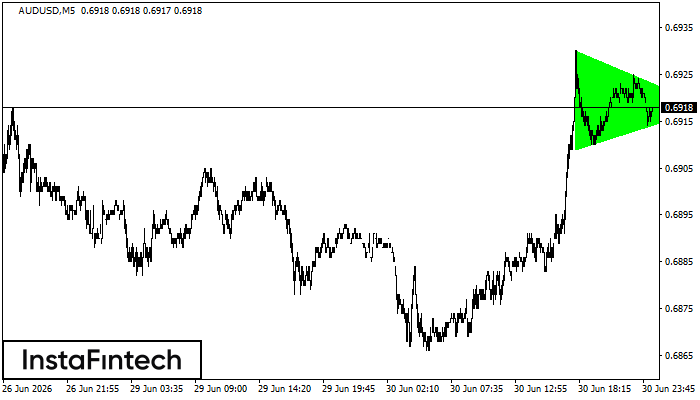
AUDUSD M5
Bullish Symmetrical Triangle
According to the chart of M5, AUDUSD formed the Bullish Symmetrical Triangle pattern, which signals the trend will continue. Description. The upper border of the pattern touches the coordinates 0.6930/0.6918 whereas the lower border goes across 0.6909/0.6918. The pattern width is measured on the chart at 21 pips. If the Bullish Symmetrical Triangle pattern is in progress during the upward trend, this indicates the current trend will go on. In case 0.6918 is broken, the price could continue its move toward 0.6933.
AUDUSD M5
Double Top
The Double Top pattern has been formed on AUDUSD M5. It signals that the trend has been changed from upwards to downwards. Probably, if the base of the pattern 0.6889 is broken, the downward movement will continue.
AUDUSD M5
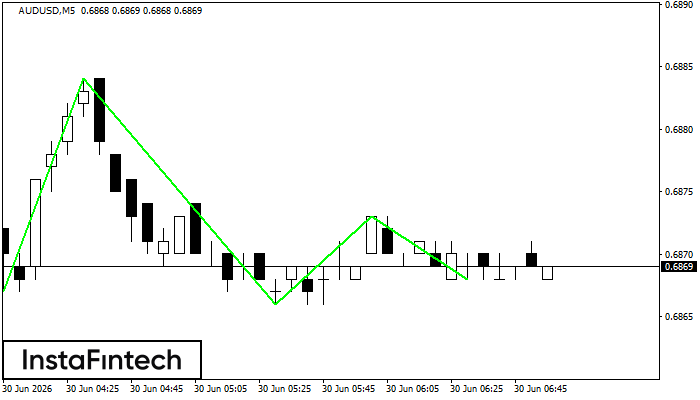
Triple Bottom
The Triple Bottom pattern has been formed on AUDUSD M5. It has the following characteristics: resistance level 0.6884/0.6873; support level 0.6867/0.6868; the width is 17 points. In the event of a breakdown of the resistance level of 0.6884, the price is likely to continue an upward movement at least to 0.6881.
AUDUSD M5
Double Top
The Double Top pattern has been formed on AUDUSD M5. It signals that the trend has been changed from upwards to downwards. Probably, if the base of the pattern 0.6886 is broken, the downward movement will continue.
AUDUSD M5
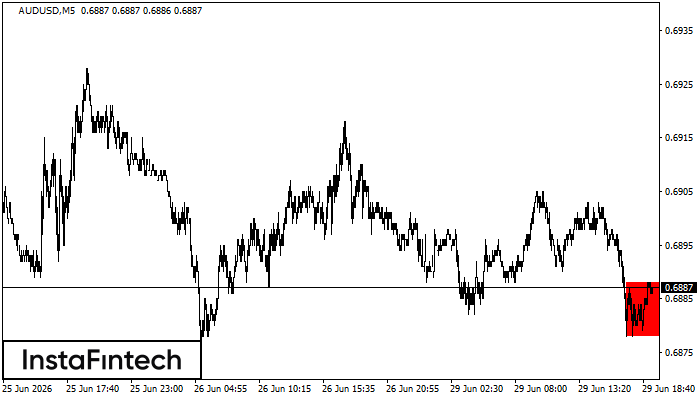
Bearish Rectangle
According to the chart of M5, AUDUSD formed the Bearish Rectangle which is a pattern of a trend continuation. The pattern is contained within the following borders: lower border 0.6878 – 0.6878 and upper border 0.6888 – 0.6888. In case the lower border is broken, the instrument is likely to follow the downward trend.
AUDUSD M5
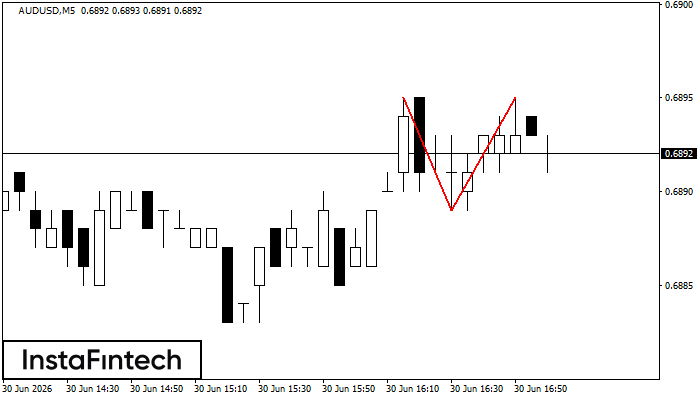
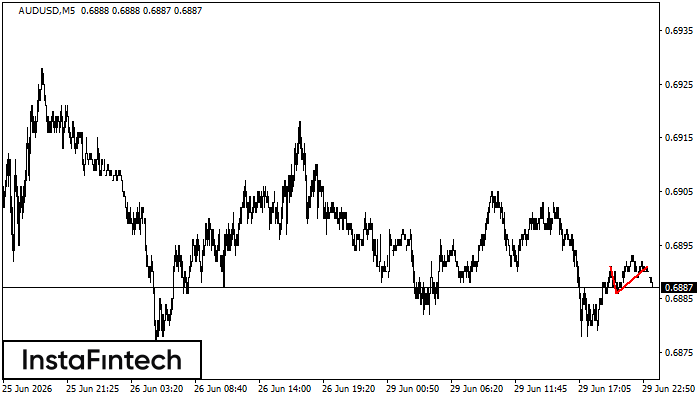
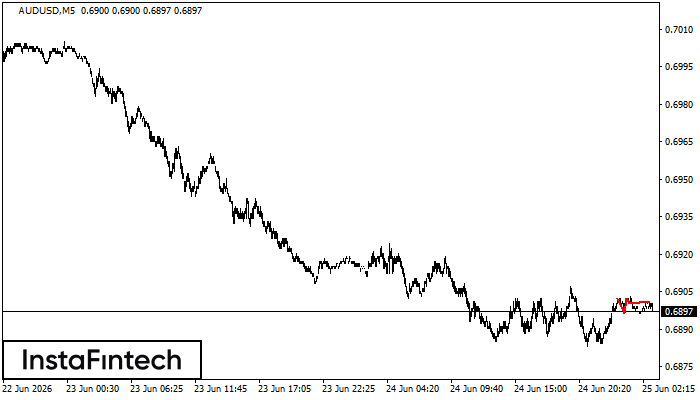
Triple Top
The Triple Top pattern has formed on the chart of the AUDUSD M5. Features of the pattern: borders have an ascending angle; the lower line of the pattern has the coordinates 0.6896/0.6900 with the upper limit 0.6902/0.6901; the projection of the width is 6 points. The formation of the Triple Top figure most likely indicates a change in the trend from upward to downward. This means that in the event of a breakdown of the support level of 0.6896, the price is most likely to continue the downward movement.
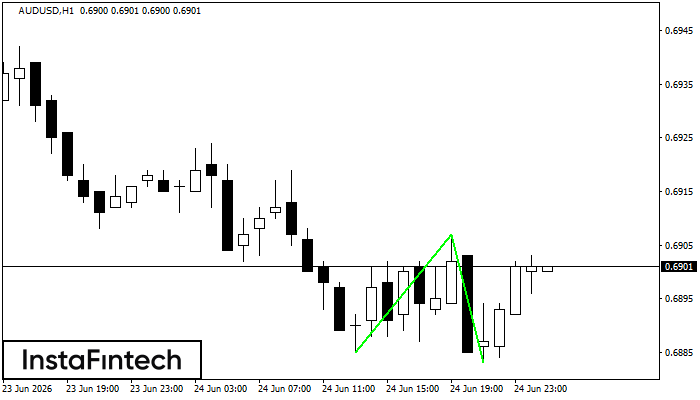
AUDUSD H1
Double Bottom
The Double Bottom pattern has been formed on AUDUSD H1. This formation signals a reversal of the trend from downwards to upwards. The signal is that a buy trade should be opened after the upper boundary of the pattern 0.6907 is broken. The further movements will rely on the width of the current pattern 22 points.