 Français
 Русский
 English
 Bahasa Indonesia
 Bahasa Malay
 ไทย
ไทย Español
 Deutsch
 Български
 Tiếng Việt
 中文
中文 বাংলা
বাংলা हिन्दी
 Čeština
 Українська
 Română
FX.co ★ Patterns EURCAD | Euro (EUR) to Canadian Dollar (CAD) Rate in the Forex market

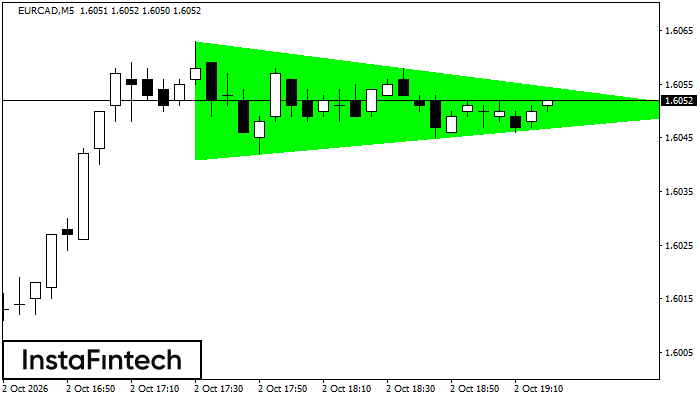
EURCAD M5
Triangle symétrique haussier
Sur le graphique M5, EURCAD a formé la figure « Triangle symétrique haussier », qui signale une poursuite de tendance. La limite supérieure passe par 1.6063/1.6050 et la limite inférieure par 1.6041/1.6050. La largeur de la figure est de 22 points. Dans une tendance haussière, la formation de « Triangle symétrique haussier » suggère la poursuite du mouvement. En cas de franchissement de 1.6050, le cours pourrait évoluer vers 1.6065.
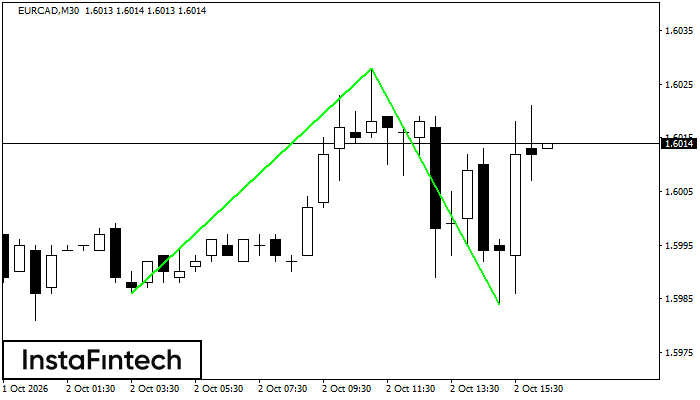
EURCAD M30
Double creux
La figure « Double creux » s’est formée sur EURCAD M30 et signale un retournement de la tendance baissière vers une tendance haussière. Une position longue peut être envisagée après le franchissement de la limite supérieure 1.6028. La largeur actuelle de la figure, soit 42 points, sert à projeter l’amplitude du prochain mouvement.
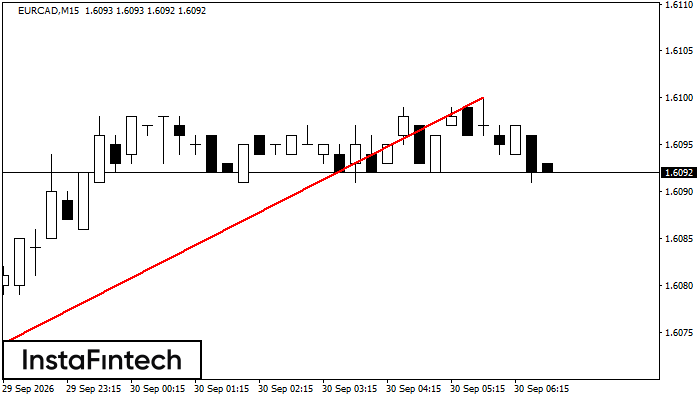
EURCAD M15
Double sommet
La figure « Double sommet » s’est formée sur EURCAD M15 et signale un passage possible d’une tendance haussière à une tendance baissière. Si la base à 1.6065 est franchie, le mouvement baissier devrait se poursuivre.
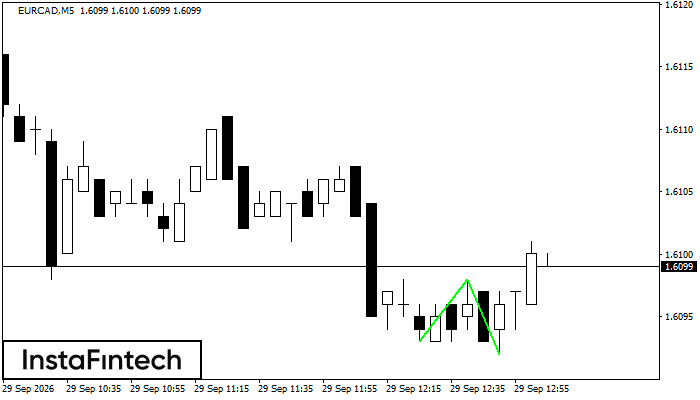
EURCAD M5
Double creux
La figure « Double creux » s’est formée sur EURCAD M5 et signale un retournement de la tendance baissière vers une tendance haussière. Une position longue peut être envisagée après le franchissement de la limite supérieure 1.6098. La largeur actuelle de la figure, soit 5 points, sert à projeter l’amplitude du prochain mouvement.
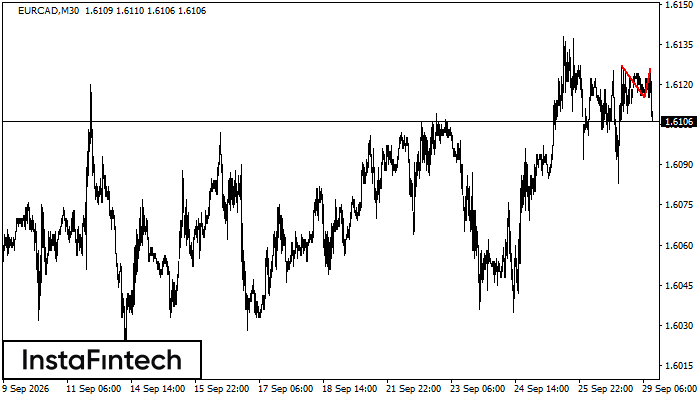
EURCAD M30
Double sommet
La figure de retournement « Double sommet » s’est formée sur EURCAD M30. La limite supérieure se situe à 1.6127, la limite inférieure à 1.6115 et la largeur est de 11 points. Une position courte peut être envisagée sous 1.6115, avec un objectif possible à 1.6085.
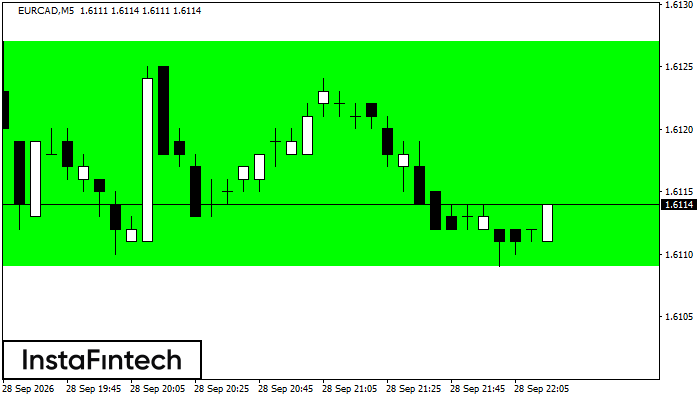
EURCAD M5
Rectangle haussier
Sur le graphique M5, EURCAD a formé la figure « Rectangle haussier », qui indique une poursuite de tendance. La limite supérieure se situe à 1.6127 et la limite inférieure à 1.6109. Le signal invite à envisager une position longue au-dessus de la limite supérieure 1.6127 de « Rectangle haussier ».
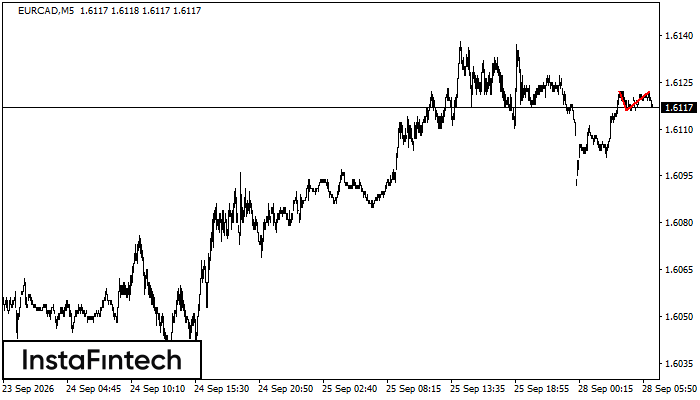
EURCAD M5
Double sommet
La figure « Double sommet » s’est formée sur EURCAD M5 et signale un passage possible d’une tendance haussière à une tendance baissière. Si la base à 1.6116 est franchie, le mouvement baissier devrait se poursuivre.
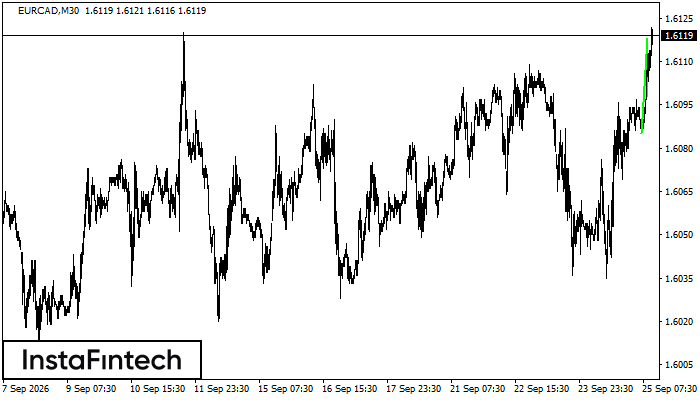
EURCAD M30
Fanion haussier
La figure « Fanion haussier » s’est formée sur le graphique EURCAD M30. Il s’agit d’une figure de continuation. Si le cours franchit son sommet à 1.6118, la hausse devrait se poursuivre vers 1.6148.
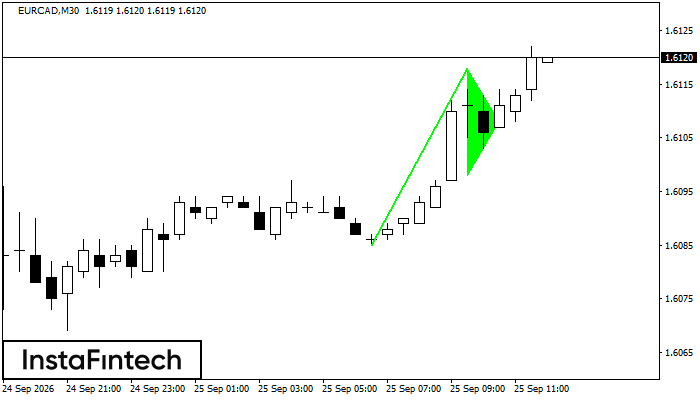
EURCAD M30
Fanion haussier
La figure « Fanion haussier » s’est formée sur le graphique EURCAD M30. Il s’agit d’une figure de continuation. Une clôture au-dessus du sommet du fanion à 1.6118 pourrait entraîner une nouvelle hausse.
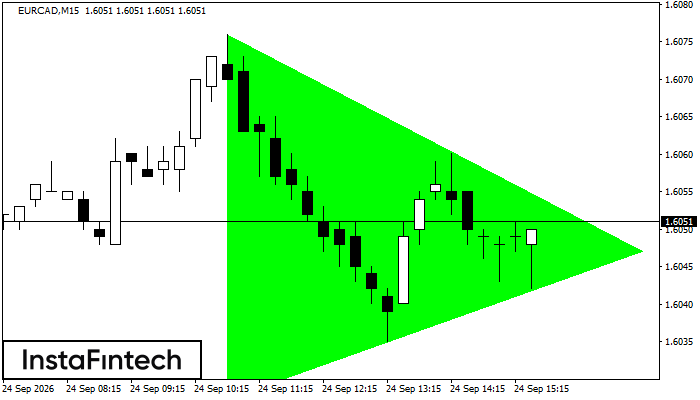
EURCAD M15
Triangle symétrique haussier
Sur le graphique M15, EURCAD a formé la figure « Triangle symétrique haussier ». La limite inférieure passe par 1.6027/1.6047 et la limite supérieure par 1.6076/1.6047. La formation de « Triangle symétrique haussier » indique une probable poursuite de la tendance haussière. Si ce scénario se confirme, le cours de EURCAD franchira la limite supérieure et se dirigera vers 1.6070.