 Français
  Русский
 English
 Bahasa Indonesia
 Bahasa Malay
 ไทย
ไทย Español
 Deutsch
 Български
 Tiếng Việt
 中文
中文 বাংলা
বাংলা हिन्दी
 Čeština
 Українська
 Română
FX.co ★ Patterns GBPAUD | British Pound (GBP) to Australian Dollar (AUD) Rate in the Forex market

GBPAUD M5
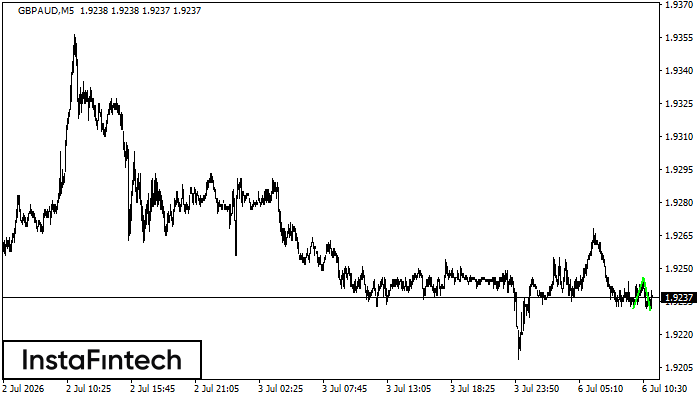
Double Bottom
The Double Bottom pattern has been formed on GBPAUD M5. This formation signals a reversal of the trend from downwards to upwards. The signal is that a buy trade should be opened after the upper boundary of the pattern 1.9246 is broken. The further movements will rely on the width of the current pattern 14 points.
GBPAUD M5
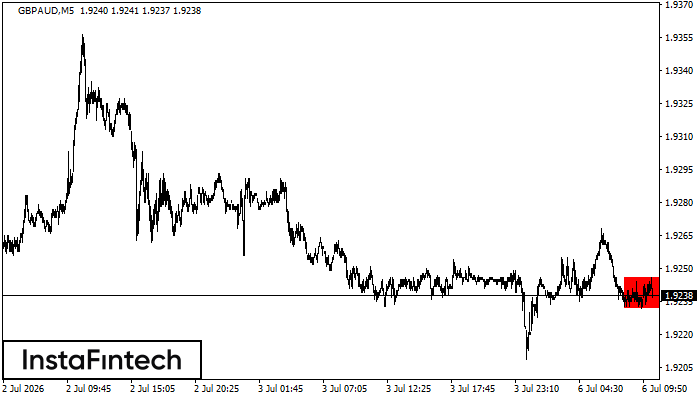
Bearish Rectangle
According to the chart of M5, GBPAUD formed the Bearish Rectangle. The pattern indicates a trend continuation. The upper border is 1.9246, the lower border is 1.9232. The signal means that a short position should be opened after fixing a price below the lower border 1.9232 of the Bearish Rectangle.
GBPAUD M5
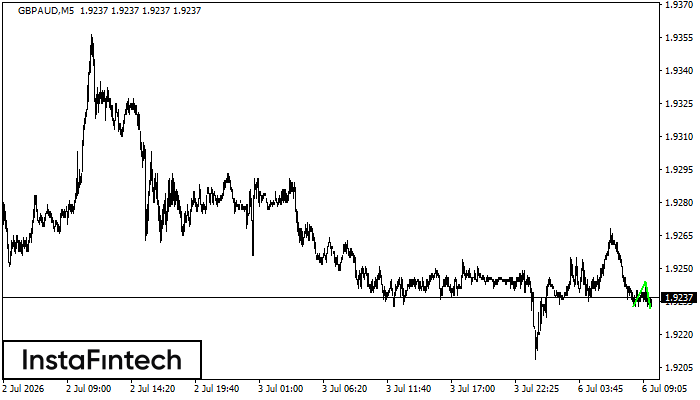
Double Bottom
The Double Bottom pattern has been formed on GBPAUD M5. This formation signals a reversal of the trend from downwards to upwards. The signal is that a buy trade should be opened after the upper boundary of the pattern 1.9244 is broken. The further movements will rely on the width of the current pattern 11 points.
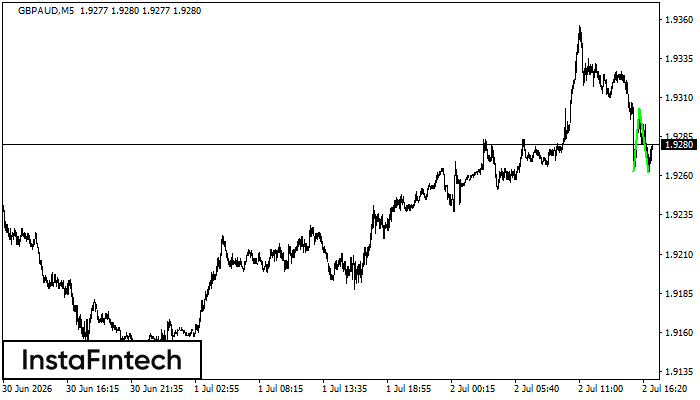
GBPAUD M5
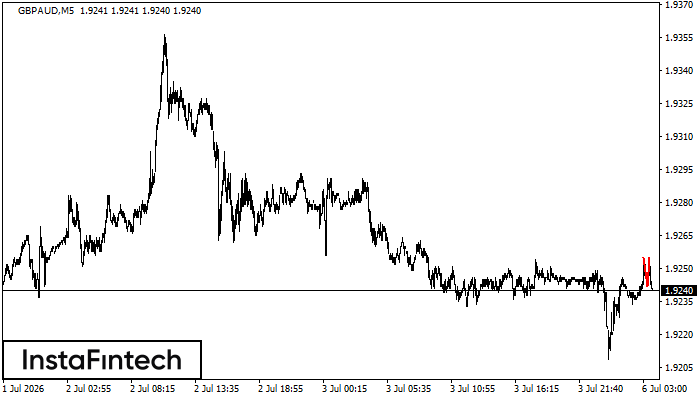
Double Top
The Double Top pattern has been formed on GBPAUD M5. It signals that the trend has been changed from upwards to downwards. Probably, if the base of the pattern 1.9242 is broken, the downward movement will continue.
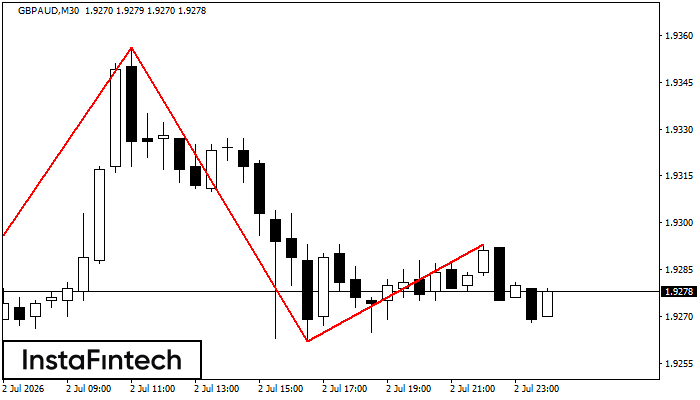
GBPAUD M30
Head and Shoulders
According to the chart of M30, GBPAUD formed the Head and Shoulders pattern. The Head’s top is set at 1.9356 while the median line of the Neck is found at 1.9251/1.9262. The formation of the Head and Shoulders pattern evidently signals a reversal of the upward trend. In other words, in case the scenario comes true, the price of GBPAUD will go towards 1.9232.
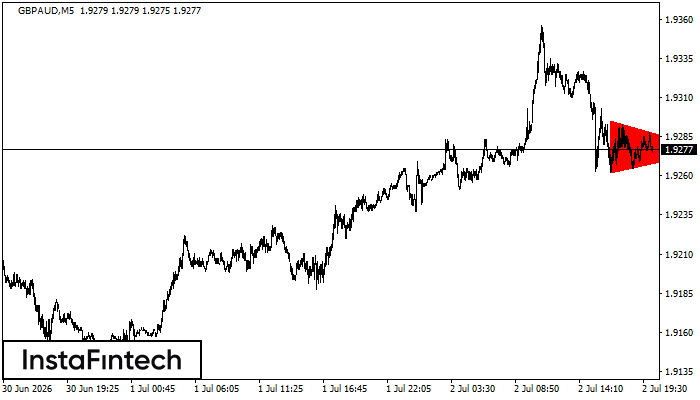
GBPAUD M5
Bearish Symmetrical Triangle
According to the chart of M5, GBPAUD formed the Bearish Symmetrical Triangle pattern. Trading recommendations: A breach of the lower border 1.9262 is likely to encourage a continuation of the downward trend.
GBPAUD M5
Double Bottom
The Double Bottom pattern has been formed on GBPAUD M5; the upper boundary is 1.9303; the lower boundary is 1.9262. The width of the pattern is 40 points. In case of a break of the upper boundary 1.9303, a change in the trend can be predicted where the width of the pattern will coincide with the distance to a possible take profit level.

GBPAUD M5
Bearish Rectangle
According to the chart of M5, GBPAUD formed the Bearish Rectangle. This type of a pattern indicates a trend continuation. It consists of two levels: resistance 1.9210 - 0.0000 and support 1.9191 – 1.9191. In case the resistance level 1.9191 - 1.9191 is broken, the instrument is likely to follow the bearish trend.
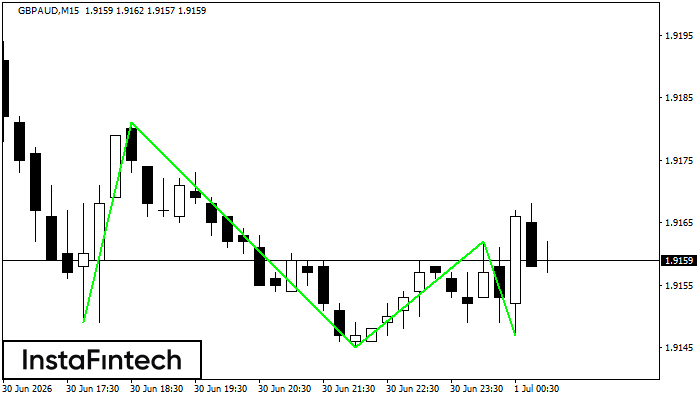
GBPAUD M15
Triple Bottom
The Triple Bottom pattern has formed on the chart of GBPAUD M15. Features of the pattern: The lower line of the pattern has coordinates 1.9181 with the upper limit 1.9181/1.9162, the projection of the width is 32 points. The formation of the Triple Bottom pattern most likely indicates a change in the trend from downward to upward. This means that in the event of a breakdown of the resistance level 1.9149, the price is most likely to continue the upward movement.
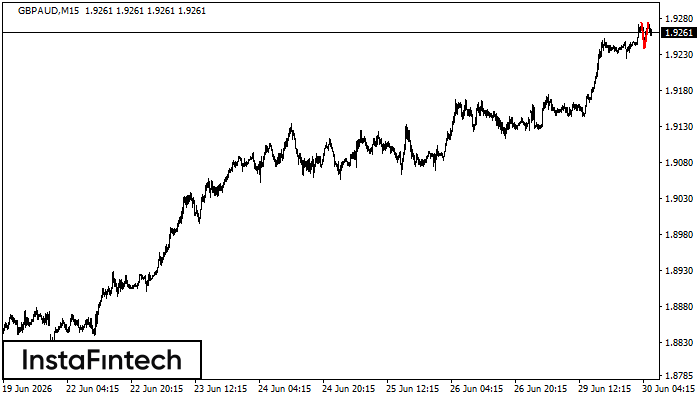
GBPAUD M15
Double Top
The Double Top pattern has been formed on GBPAUD M15. It signals that the trend has been changed from upwards to downwards. Probably, if the base of the pattern 1.9238 is broken, the downward movement will continue.