 Français
  Русский
 English
 Bahasa Indonesia
 Bahasa Malay
 ไทย
ไทย Español
 Deutsch
 Български
 Tiếng Việt
 中文
中文 বাংলা
বাংলা हिन्दी
 Čeština
 Українська
 Română
FX.co ★ Patterns GOLD | Taux de l'or sur le marché Forex

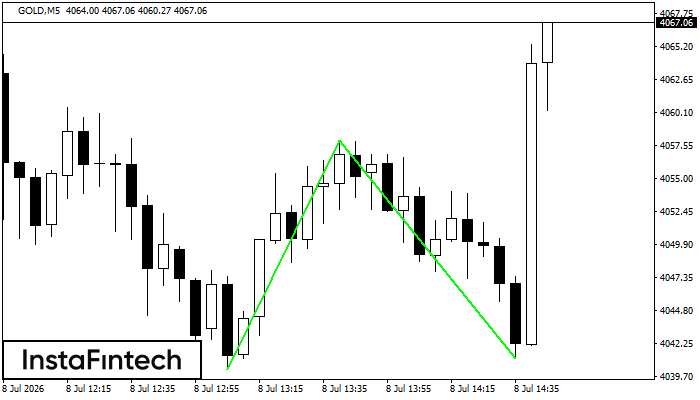
GOLD M5
Double Bottom
The Double Bottom pattern has been formed on GOLD M5; the upper boundary is 4057.91; the lower boundary is 4041.06. The width of the pattern is 1769 points. In case of a break of the upper boundary 4057.91, a change in the trend can be predicted where the width of the pattern will coincide with the distance to a possible take profit level.
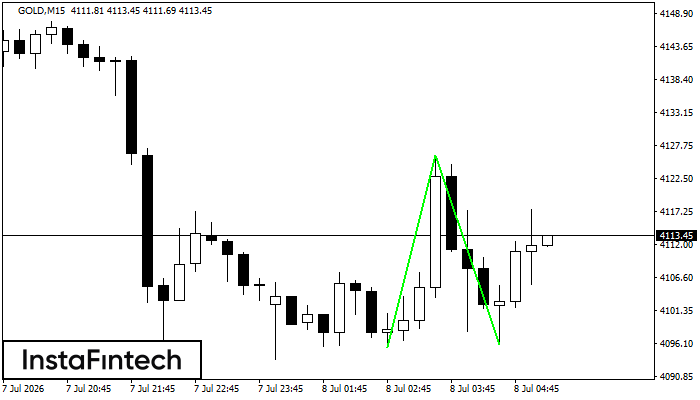
GOLD M15
Double Bottom
The Double Bottom pattern has been formed on GOLD M15; the upper boundary is 4126.22; the lower boundary is 4095.97. The width of the pattern is 3075 points. In case of a break of the upper boundary 4126.22, a change in the trend can be predicted where the width of the pattern will coincide with the distance to a possible take profit level.
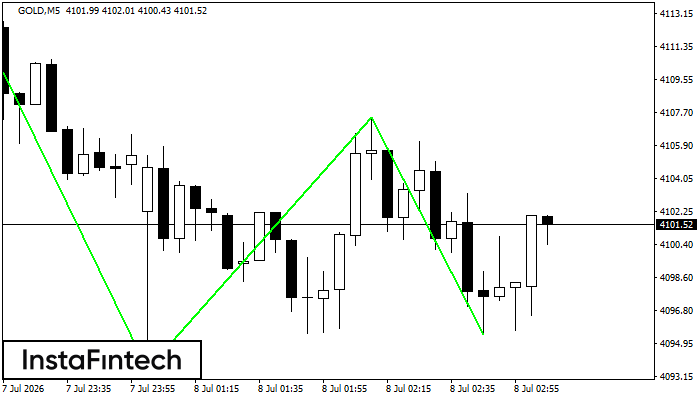
GOLD M5
Triple Bottom
The Triple Bottom pattern has been formed on GOLD M5. It has the following characteristics: resistance level 4117.22/4107.46; support level 4091.84/4095.47; the width is 2538 points. In the event of a breakdown of the resistance level of 4117.22, the price is likely to continue an upward movement at least to 4093.68.
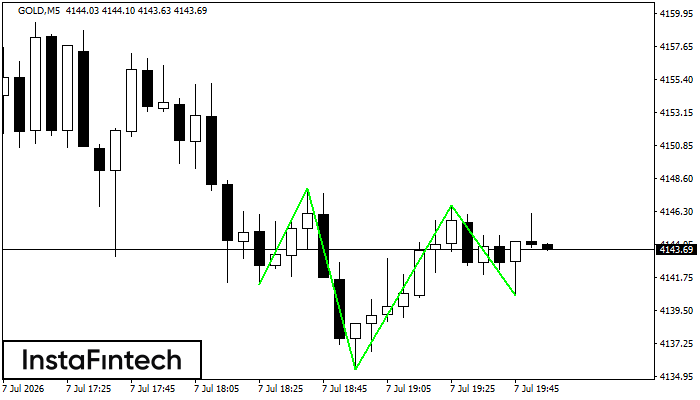
GOLD M5
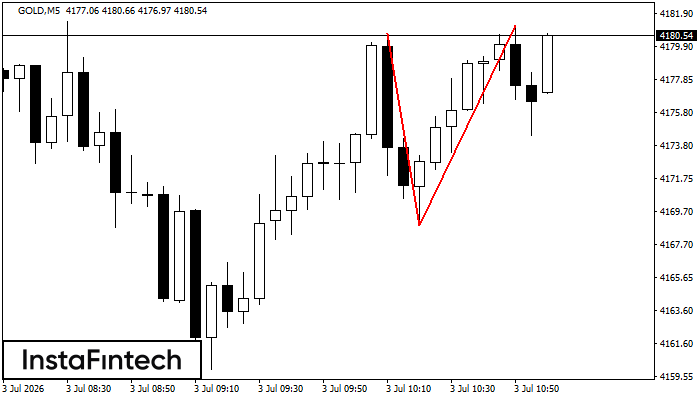
Inverse Head and Shoulder
According to the chart of M5, GOLD formed the Inverse Head and Shoulder pattern. The Head’s top is set at 4146.76 while the median line of the Neck is found at 4135.44/4140.53. The formation of the Inverse Head and Shoulder pattern evidently signals a reversal of the downward trend. In other words, in case the scenario comes true, the price of GOLD will go towards 4146.91
GOLD M5
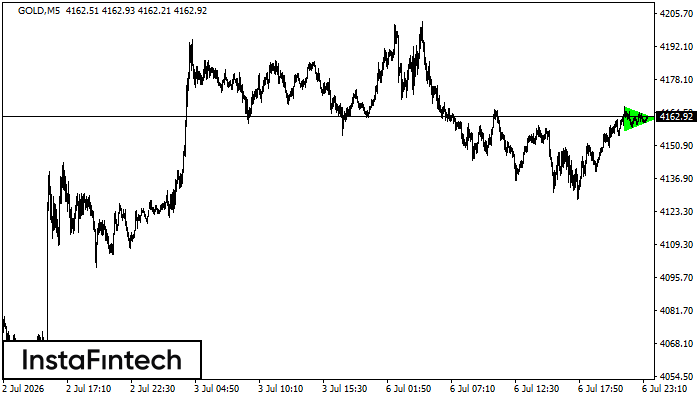
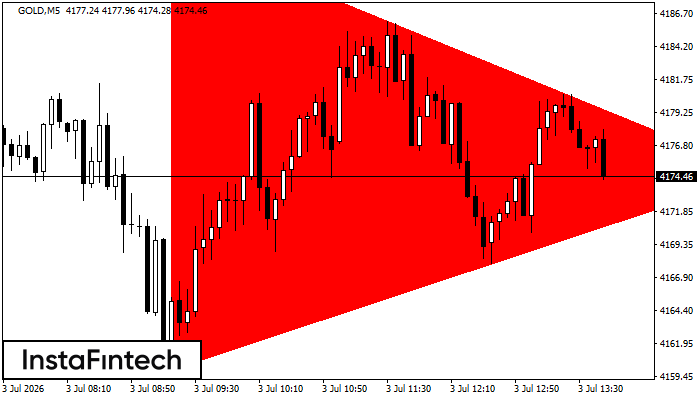
Bullish Symmetrical Triangle
According to the chart of M5, GOLD formed the Bullish Symmetrical Triangle pattern. The lower border of the pattern touches the coordinates 4157.08/4162.16 whereas the upper border goes across 4166.99/4162.16. If the Bullish Symmetrical Triangle pattern is in progress, this evidently signals a further upward trend. In other words, in case the scenario comes true, the price of GOLD will breach the upper border to head for 4162.31.
GOLD M5
Double Top
The Double Top pattern has been formed on GOLD M5. It signals that the trend has been changed from upwards to downwards. Probably, if the base of the pattern 4170.13 is broken, the downward movement will continue.
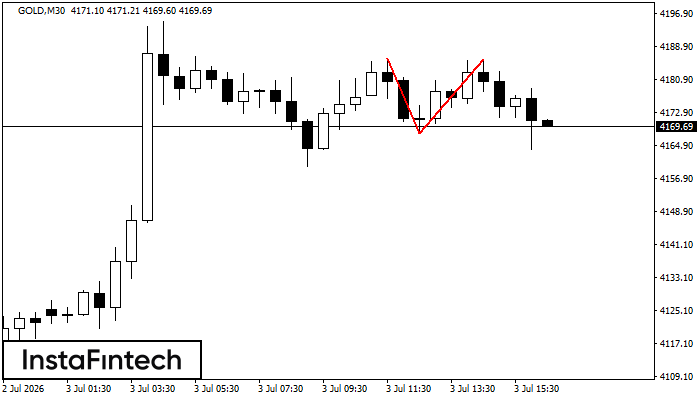
GOLD M30
Double Top
The Double Top pattern has been formed on GOLD M30. It signals that the trend has been changed from upwards to downwards. Probably, if the base of the pattern 4167.98 is broken, the downward movement will continue.
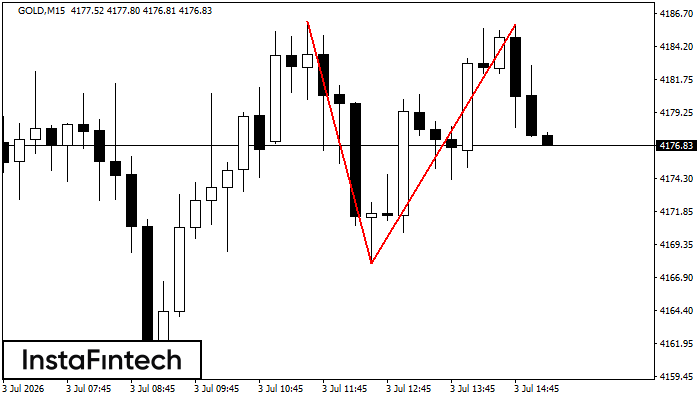
GOLD M15
Double Top
On the chart of GOLD M15 the Double Top reversal pattern has been formed. Characteristics: the upper boundary 4185.83; the lower boundary 4167.98; the width of the pattern 1785 points. The signal: a break of the lower boundary will cause continuation of the downward trend targeting the 4167.75 level.
GOLD M5
Bearish Symmetrical Triangle
According to the chart of M5, GOLD formed the Bearish Symmetrical Triangle pattern. This pattern signals a further downward trend in case the lower border 4160.01 is breached. Here, a hypothetical profit will equal the width of the available pattern that is -3278 pips.
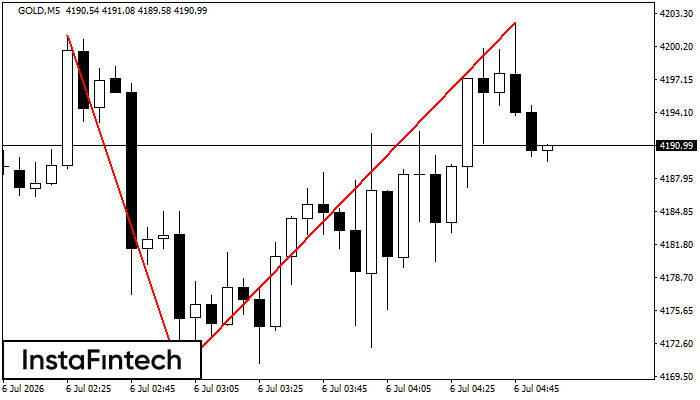
GOLD M5
Double Top
The Double Top reversal pattern has been formed on GOLD M5. Characteristics: the upper boundary 4180.67; the lower boundary 4168.83; the width of the pattern is 1235 points. Sell trades are better to be opened below the lower boundary 4168.83 with a possible movements towards the 4168.68 level.