 Français
  Русский
 English
 Bahasa Indonesia
 Bahasa Malay
 ไทย
ไทย Español
 Deutsch
 Български
 Tiếng Việt
 中文
中文 বাংলা
বাংলা हिन्दी
 Čeština
 Українська
 Română
FX.co ★ Patterns #INTC | Intel Corporation Stock Price

#INTC M5
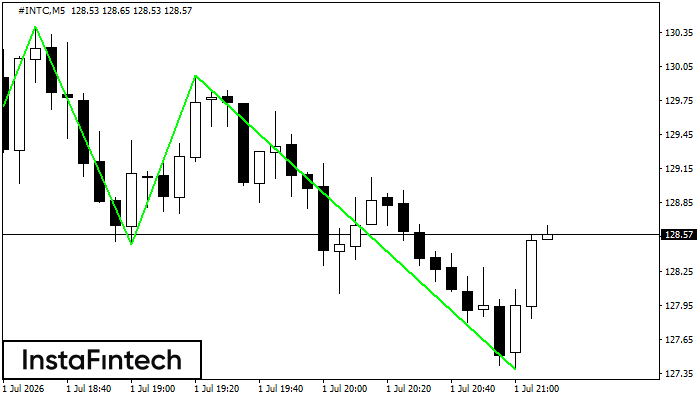
Triple Bottom
The Triple Bottom pattern has formed on the chart of #INTC M5. Features of the pattern: The lower line of the pattern has coordinates 130.40 with the upper limit 130.40/129.97, the projection of the width is 244 points. The formation of the Triple Bottom pattern most likely indicates a change in the trend from downward to upward. This means that in the event of a breakdown of the resistance level 127.96, the price is most likely to continue the upward movement.
#INTC M5
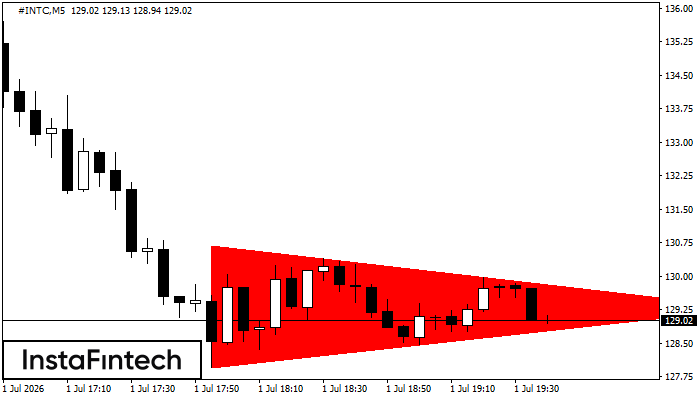
Bearish Symmetrical Triangle
According to the chart of M5, #INTC formed the Bearish Symmetrical Triangle pattern. This pattern signals a further downward trend in case the lower border 127.96 is breached. Here, a hypothetical profit will equal the width of the available pattern that is -274 pips.
#INTC H1
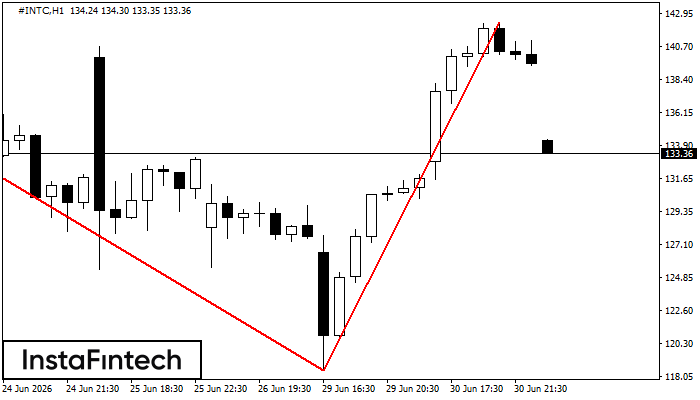
Double Top
The Double Top reversal pattern has been formed on #INTC H1. Characteristics: the upper boundary 141.42; the lower boundary 118.51; the width of the pattern is 2381 points. Sell trades are better to be opened below the lower boundary 118.51 with a possible movements towards the 118.11 level.
#INTC M5
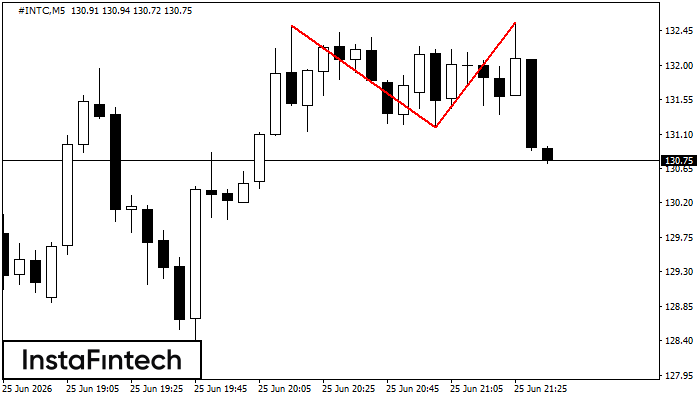
Double Top
On the chart of #INTC M5 the Double Top reversal pattern has been formed. Characteristics: the upper boundary 132.56; the lower boundary 131.19; the width of the pattern 137 points. The signal: a break of the lower boundary will cause continuation of the downward trend targeting the 131.04 level.
#INTC M15
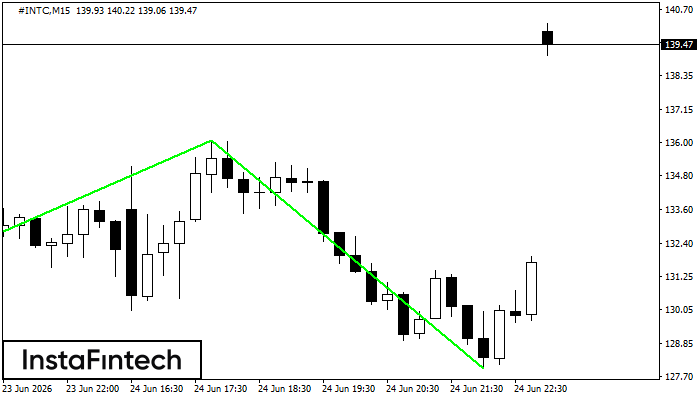
Double Bottom
The Double Bottom pattern has been formed on #INTC M15; the upper boundary is 136.05; the lower boundary is 127.98. The width of the pattern is 768 points. In case of a break of the upper boundary 136.05, a change in the trend can be predicted where the width of the pattern will coincide with the distance to a possible take profit level.
#INTC M5
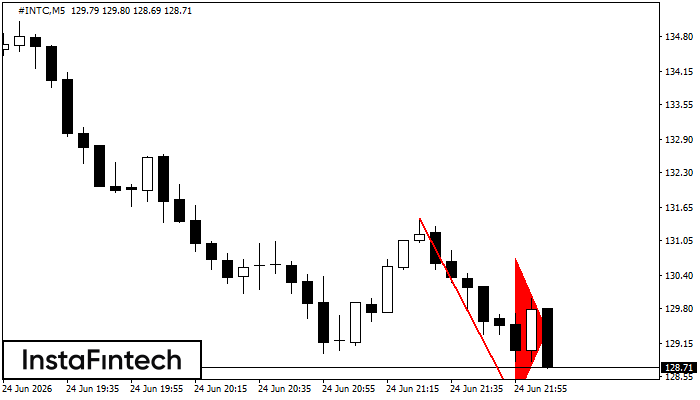
Bearish pennant
The Bearish pennant pattern has formed on the #INTC M5 chart. The pattern signals continuation of the downtrend in case the pennant’s low of 128.07 is broken through. Recommendations: Place the sell stop pending order 10 pips below the pattern’s low. Place the take profit order at the projection distance of the flagpole height.
#INTC M5
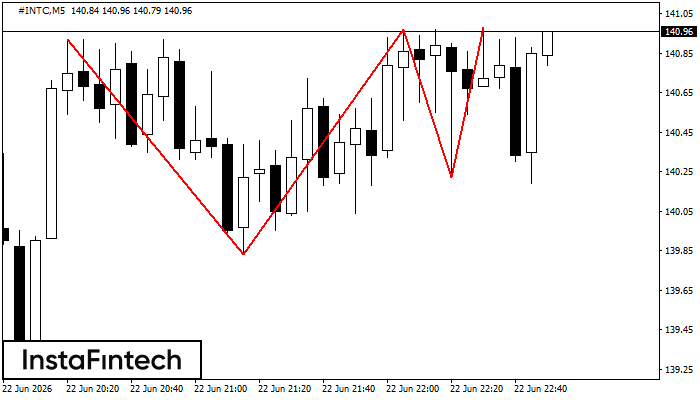
Triple Top
The Triple Top pattern has formed on the chart of the #INTC M5. Features of the pattern: borders have an ascending angle; the lower line of the pattern has the coordinates 139.83/140.22 with the upper limit 140.92/140.98; the projection of the width is 109 points. The formation of the Triple Top figure most likely indicates a change in the trend from upward to downward. This means that in the event of a breakdown of the support level of 139.83, the price is most likely to continue the downward movement.
#INTC M15
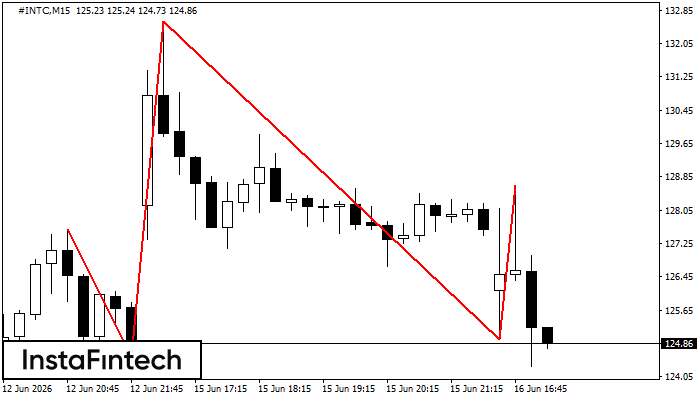
Head and Shoulders
The #INTC M15 formed the Head and Shoulders pattern with the following features: The Head’s top is at 132.57, the Neckline and the upward angle are at 124.55/124.94. The formation of this pattern can bring about changes in the current trend from bullish to bearish. In case the pattern triggers the expected changes, the price of #INTC will go towards 124.71.
#INTC M5
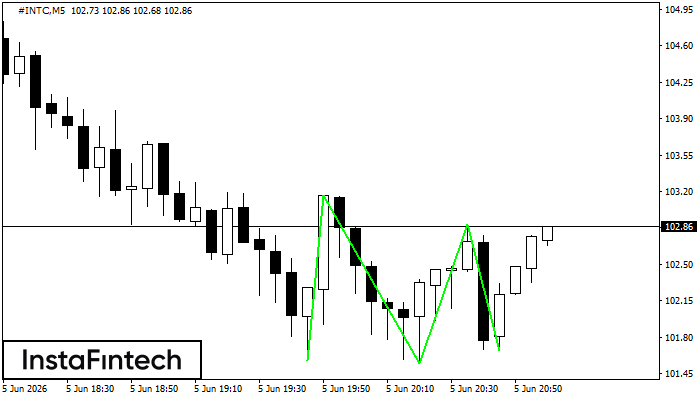
Triple Bottom
The Triple Bottom pattern has been formed on #INTC M5. It has the following characteristics: resistance level 103.16/102.88; support level 101.58/101.67; the width is 158 points. In the event of a breakdown of the resistance level of 103.16, the price is likely to continue an upward movement at least to 101.70.
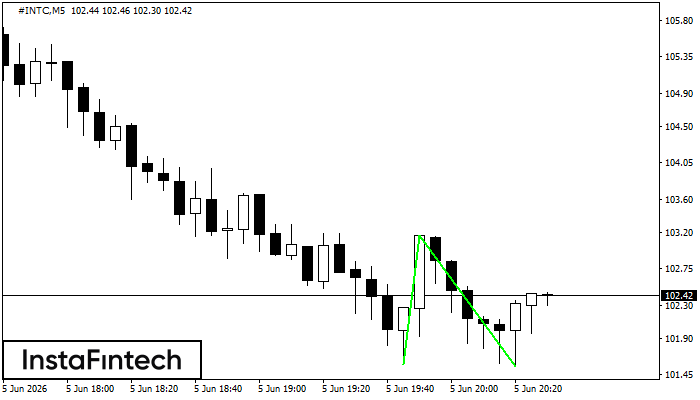
#INTC M5
Double Bottom
The Double Bottom pattern has been formed on #INTC M5. Characteristics: the support level 101.58; the resistance level 103.16; the width of the pattern 158 points. If the resistance level is broken, a change in the trend can be predicted with the first target point lying at the distance of 161 points.