 Français
  Русский
 English
 Bahasa Indonesia
 Bahasa Malay
 ไทย
ไทย Español
 Deutsch
 Български
 Tiếng Việt
 中文
中文 বাংলা
বাংলা हिन्दी
 Čeština
 Українська
 Română
FX.co ★ Patterns #KO | The Coca-Cola Company Stock Price

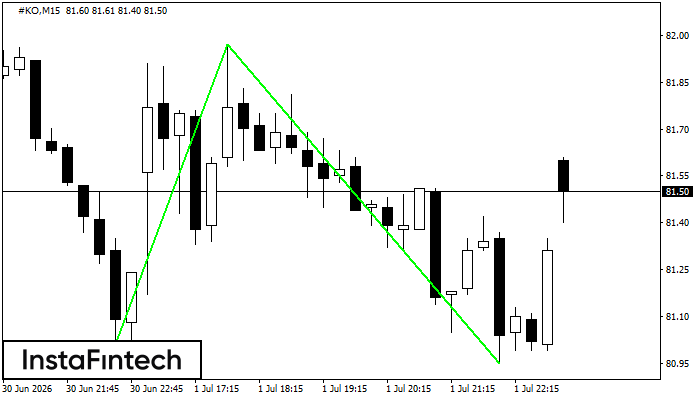
#KO M15
Double Bottom
The Double Bottom pattern has been formed on #KO M15; the upper boundary is 81.97; the lower boundary is 80.95. The width of the pattern is 96 points. In case of a break of the upper boundary 81.97, a change in the trend can be predicted where the width of the pattern will coincide with the distance to a possible take profit level.
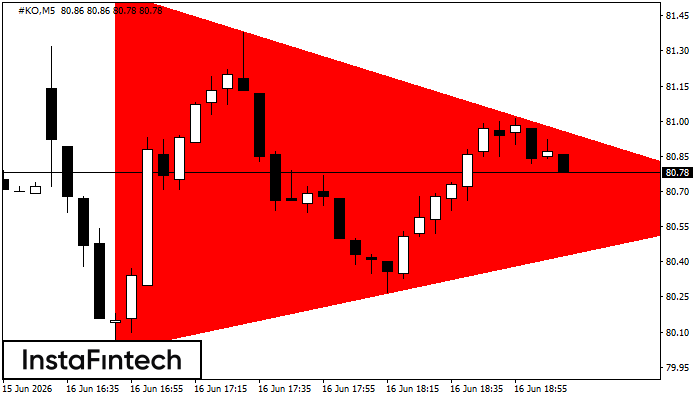
#KO M5
Bearish Symmetrical Triangle
According to the chart of M5, #KO formed the Bearish Symmetrical Triangle pattern. Description: The lower border is 80.02/80.64 and upper border is 81.55/80.64. The pattern width is measured on the chart at -153 pips. The formation of the Bearish Symmetrical Triangle pattern evidently signals a continuation of the downward trend. In other words, if the scenario comes true and #KO breaches the lower border, the price could continue its move toward 80.49.
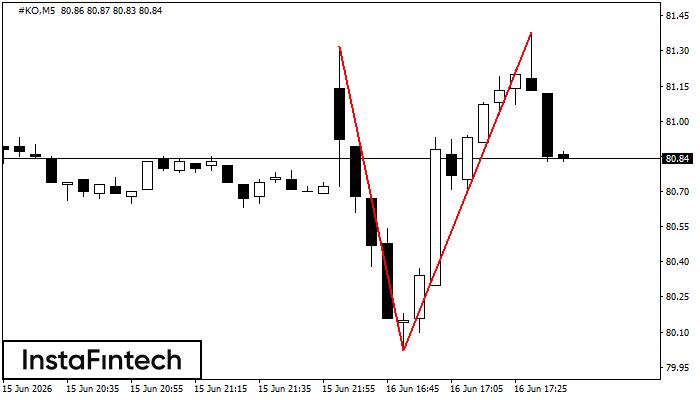
#KO M5
Double Top
The Double Top pattern has been formed on #KO M5. It signals that the trend has been changed from upwards to downwards. Probably, if the base of the pattern 80.02 is broken, the downward movement will continue.
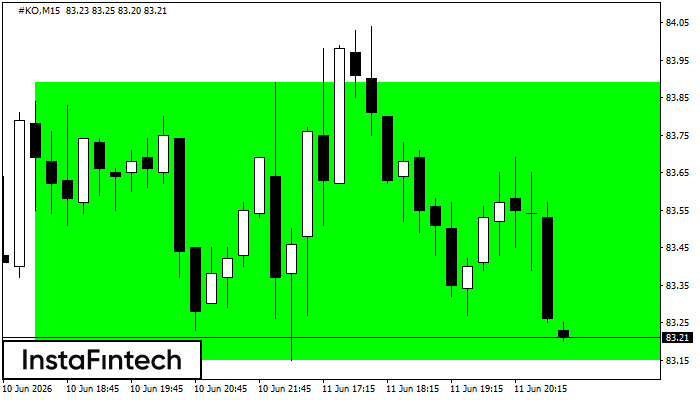
#KO M15
Bullish Rectangle
According to the chart of M15, #KO formed the Bullish Rectangle which is a pattern of a trend continuation. The pattern is contained within the following borders: the lower border 83.15 – 83.15 and upper border 83.89 – 83.89. In case the upper border is broken, the instrument is likely to follow the upward trend.
#KO M15
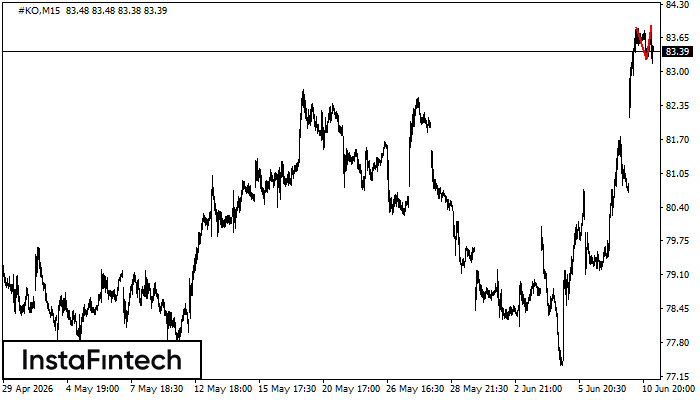
Double Top
On the chart of #KO M15 the Double Top reversal pattern has been formed. Characteristics: the upper boundary 83.89; the lower boundary 83.23; the width of the pattern 66 points. The signal: a break of the lower boundary will cause continuation of the downward trend targeting the 83.00 level.
#KO M5
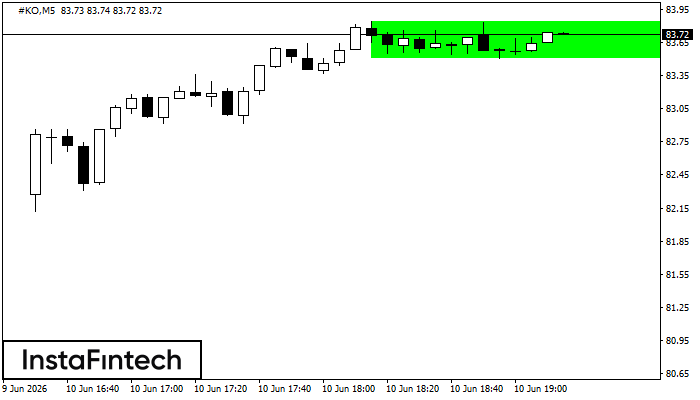
Bullish Rectangle
According to the chart of M5, #KO formed the Bullish Rectangle. The pattern indicates a trend continuation. The upper border is 83.84, the lower border is 83.51. The signal means that a long position should be opened above the upper border 83.84 of the Bullish Rectangle.
#KO M5
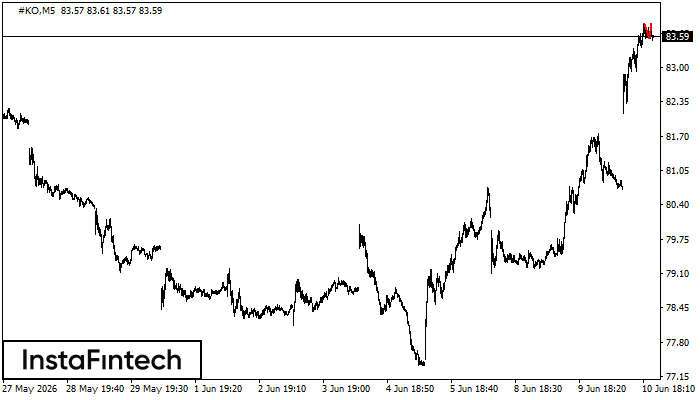
Double Top
The Double Top reversal pattern has been formed on #KO M5. Characteristics: the upper boundary 83.84; the lower boundary 83.54; the width of the pattern is 29 points. Sell trades are better to be opened below the lower boundary 83.54 with a possible movements towards the 83.39 level.
#KO M5
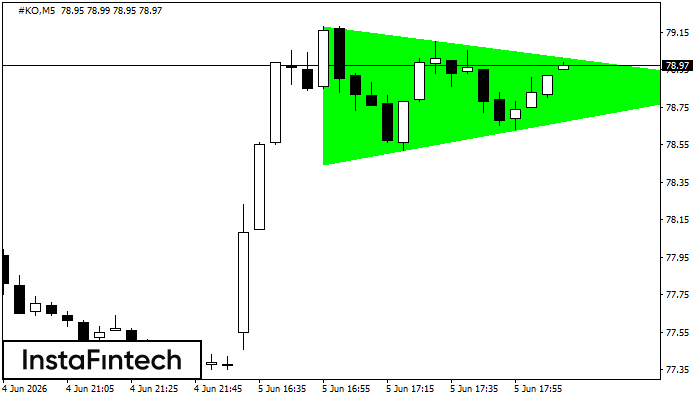
Bullish Symmetrical Triangle
According to the chart of M5, #KO formed the Bullish Symmetrical Triangle pattern. The lower border of the pattern touches the coordinates 78.44/78.87 whereas the upper border goes across 79.18/78.87. If the Bullish Symmetrical Triangle pattern is in progress, this evidently signals a further upward trend. In other words, in case the scenario comes true, the price of #KO will breach the upper border to head for 79.02.
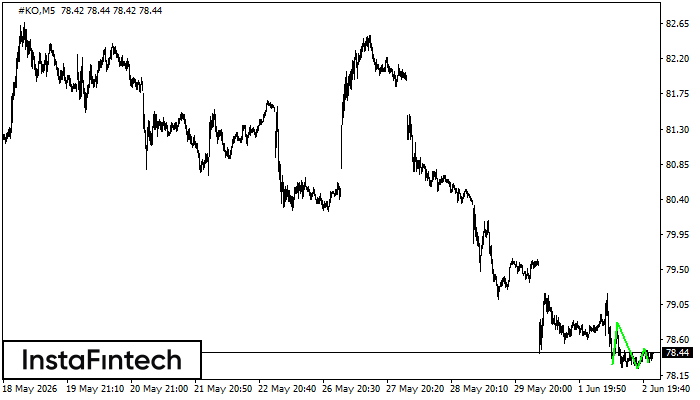
#KO M5
Triple Bottom
The Triple Bottom pattern has formed on the chart of #KO M5. Features of the pattern: The lower line of the pattern has coordinates 78.82 with the upper limit 78.82/78.49, the projection of the width is 54 points. The formation of the Triple Bottom pattern most likely indicates a change in the trend from downward to upward. This means that in the event of a breakdown of the resistance level 78.28, the price is most likely to continue the upward movement.
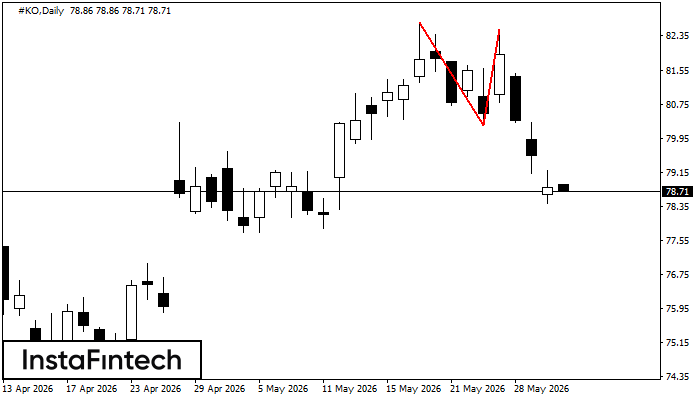
#KO D1
Double Top
The Double Top reversal pattern has been formed on #KO D1. Characteristics: the upper boundary 82.66; the lower boundary 80.24; the width of the pattern is 226 points. Sell trades are better to be opened below the lower boundary 80.24 with a possible movements towards the 79.84 level.