 Română
 Русский
 English
 Bahasa Indonesia
 Bahasa Malay
 ไทย
ไทย Español
 Deutsch
 Български
 Français
 Tiếng Việt
 中文
中文 বাংলা
বাংলা हिन्दी
 Čeština
 Українська
FX.co ★ Patterns #AMZN | Amazon.com, Inc. Stock Price

#AMZN M5
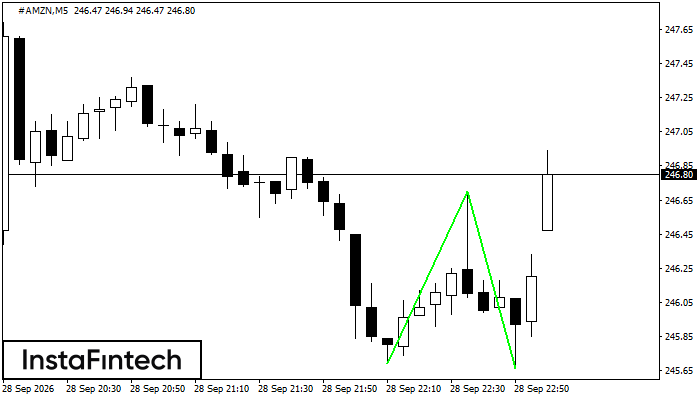
Double Bottom
The Double Bottom pattern has formed on the #AMZN M5 chart. Its support is at 245.69, its resistance is at 246.70, and its width is 101 points. A break above resistance may confirm a trend reversal, with the first target projected 104 points away.
#AMZN M15
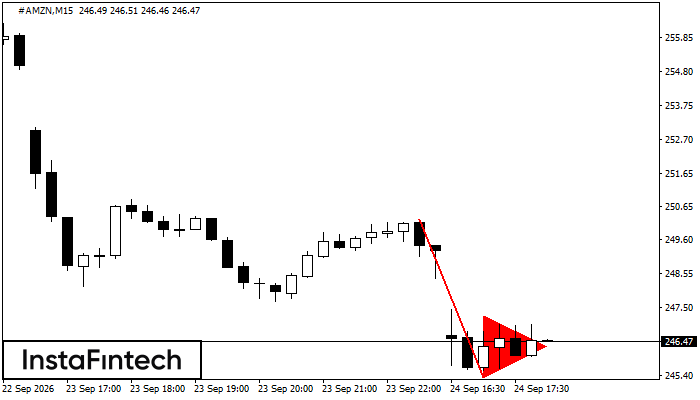
Bearish Pennant
The Bearish Pennant pattern has formed on the #AMZN M15 chart and signals a potential continuation of the existing trend. The pattern low is at 245.34, and the projected flagpole height is 489 points. If the price breaks below the pattern low at 245.34, the downtrend is expected to continue toward 245.12.
#AMZN M15
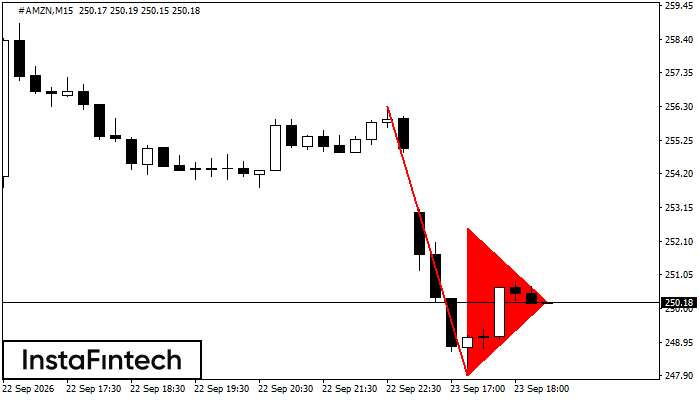
Bearish Pennant
The Bearish Pennant pattern has formed on the #AMZN M15 chart and signals a potential continuation of the existing trend. The pattern low is at 247.90, and the projected flagpole height is 839 points. If the price breaks below the pattern low at 247.90, the downtrend is expected to continue toward 247.68.
#AMZN M15
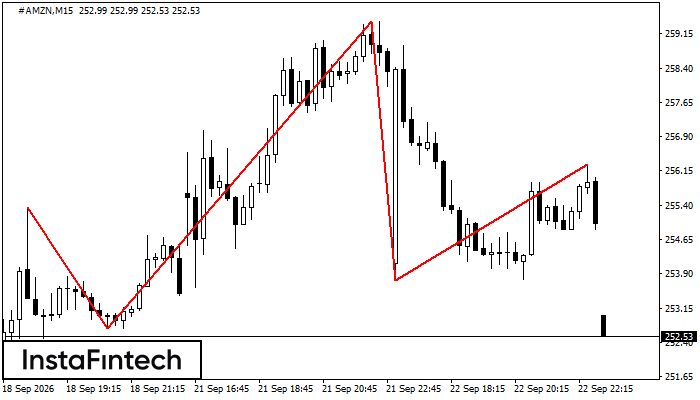
Head and Shoulders
The Head and Shoulders pattern has formed on the #AMZN M15 chart. The head high is at 259.42, while the neckline passes through 252.70/253.76. The pattern may reverse the current uptrend. A break below the lower neckline anchor may confirm the bearish reversal.
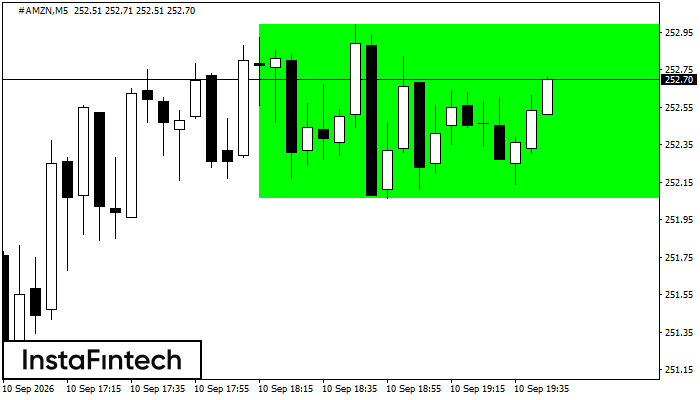
#AMZN M5
Bullish Rectangle
The Bullish Rectangle has formed on the #AMZN M5 chart. This is a trend continuation pattern bounded by the lower boundary at 252.06–252.06 and the upper boundary at 252.99–252.99. A breakout above the upper boundary is likely to signal a continuation of the uptrend.
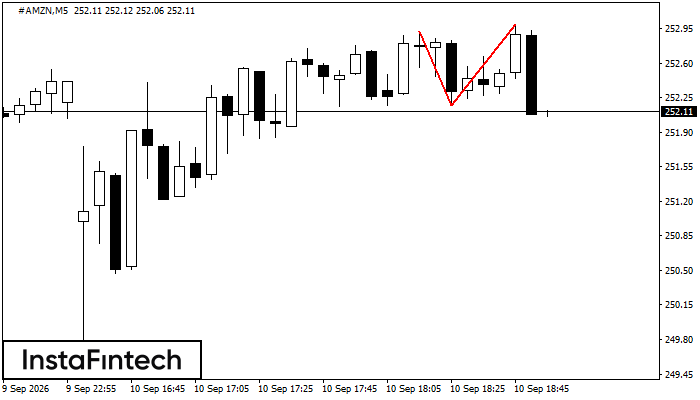
#AMZN M5
Double Top
The Double Top pattern has formed on the #AMZN M5 chart and signals a potential reversal from an uptrend to a downtrend. A break below the pattern base at 252.17 is likely to confirm further downward movement.
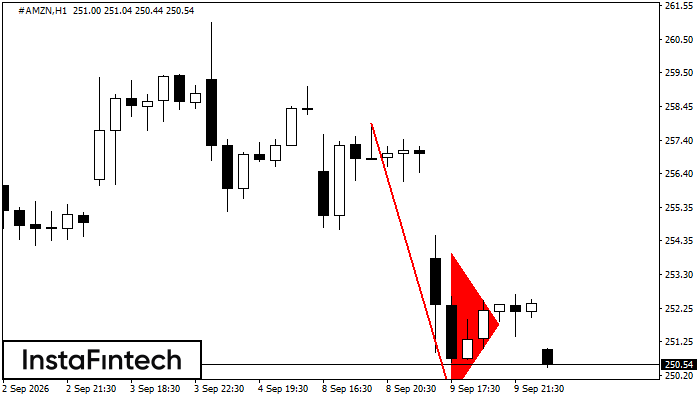
#AMZN H1
Bearish Pennant
The Bearish Pennant pattern has formed on the #AMZN H1 chart. It represents a brief consolidation before the price potentially resumes the prevailing trend. A short position may be considered if the price closes below the pattern low at 249.56.
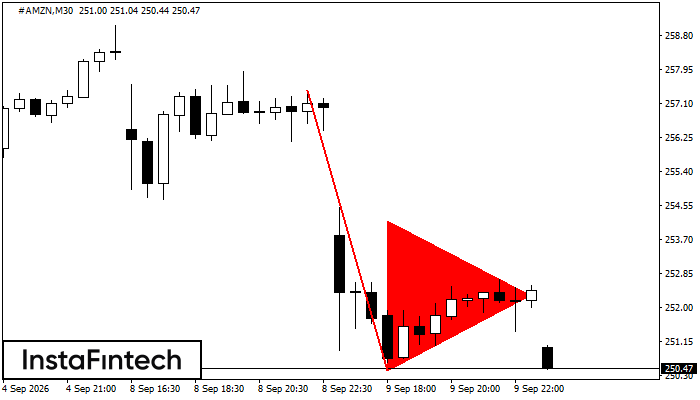
#AMZN M30
Bearish Pennant
The Bearish Pennant pattern has formed on the #AMZN M30 chart. A break below the pennant low at 250.41 would signal a likely continuation of the downtrend. A Sell Stop order may be placed 10 points below the pattern low, with Take Profit set at a distance equal to the height of the flagpole.
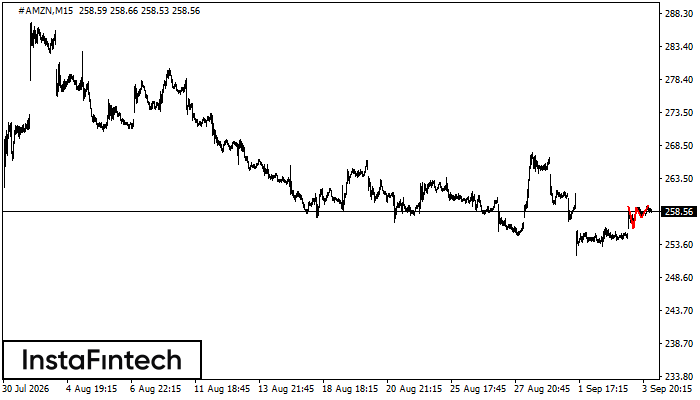
#AMZN M15
Triple Top
The Triple Top reversal pattern has formed on the #AMZN M15 chart. Its upper boundary is at 259.35/259.43, its lower boundary is at 256.05/257.71, and its current width is 155 points. If the confirmation support at 256.05 is broken, that width can be used to project the downward move.
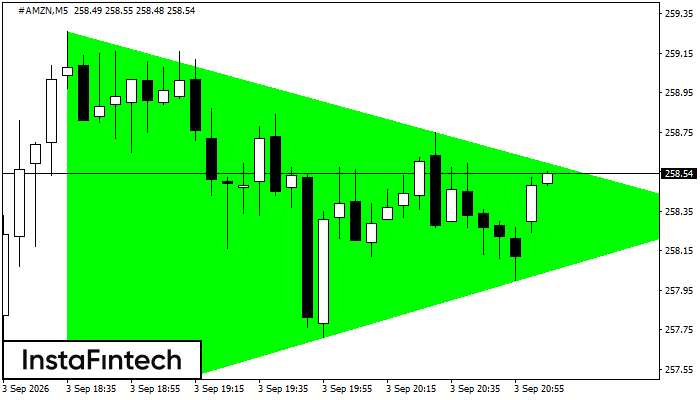
#AMZN M5
Bullish Symmetrical Triangle
The Bullish Symmetrical Triangle pattern has formed on the #AMZN M5 chart. This is a trend continuation pattern. Its upper and lower boundaries are at 259.26 and 257.32, respectively. The pattern width is 194 points. If the price breaks above the upper boundary at 259.26, it is likely to move toward 258.48.