 Română
  Русский
 English
 Bahasa Indonesia
 Bahasa Malay
 ไทย
ไทย Español
 Deutsch
 Български
 Français
 Tiếng Việt
 中文
中文 বাংলা
বাংলা हिन्दी
 Čeština
 Українська
FX.co ★ Patterns AUDCAD | Australian Dollar (AUD) to Canadian Dollar (CAD) Rate in the Forex market

AUDCAD M30
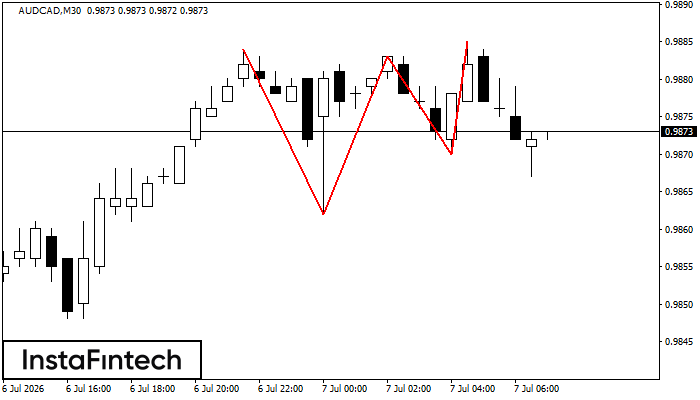
Triple Top
The Triple Top pattern has formed on the chart of the AUDCAD M30. Features of the pattern: borders have an ascending angle; the lower line of the pattern has the coordinates 0.9862/0.9870 with the upper limit 0.9884/0.9885; the projection of the width is 22 points. The formation of the Triple Top figure most likely indicates a change in the trend from upward to downward. This means that in the event of a breakdown of the support level of 0.9862, the price is most likely to continue the downward movement.
AUDCAD H1
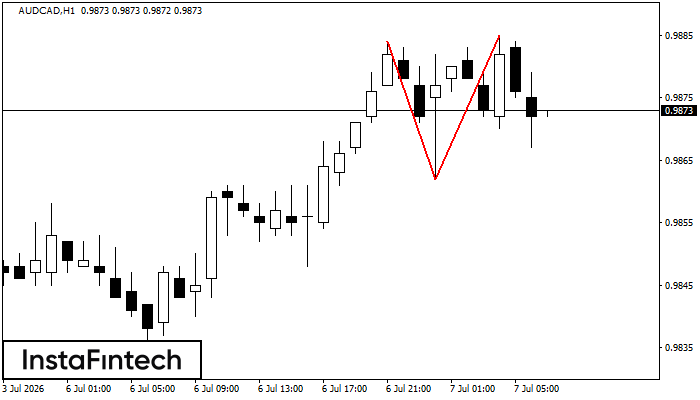
Double Top
The Double Top reversal pattern has been formed on AUDCAD H1. Characteristics: the upper boundary 0.9884; the lower boundary 0.9862; the width of the pattern is 23 points. Sell trades are better to be opened below the lower boundary 0.9862 with a possible movements towards the 0.9822 level.
AUDCAD M15
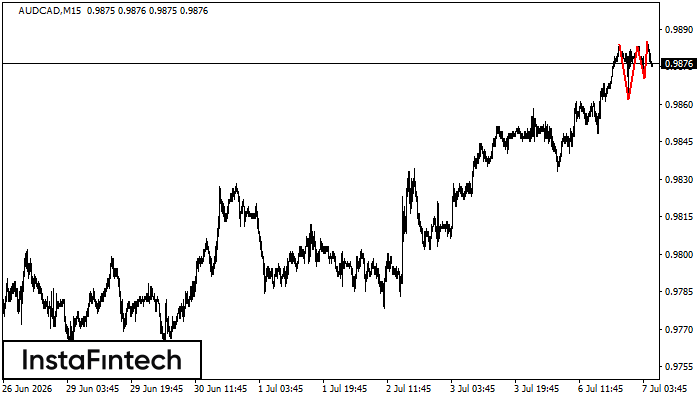
Triple Top
On the chart of the AUDCAD M15 trading instrument, the Triple Top pattern that signals a trend change has formed. It is possible that after formation of the third peak, the price will try to break through the resistance level 0.9862, where we advise to open a trading position for sale. Take profit is the projection of the pattern’s width, which is 22 points.
AUDCAD M30
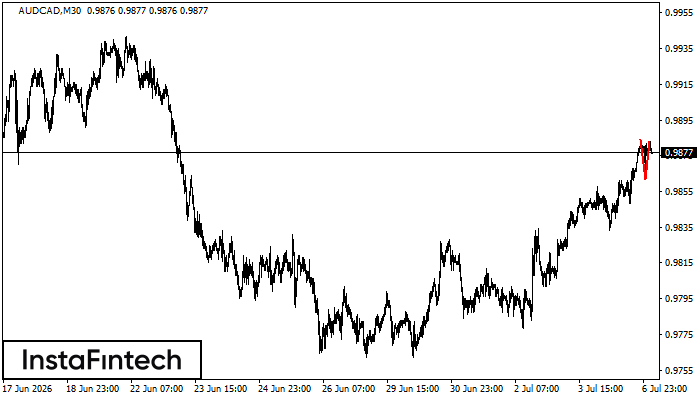
Double Top
The Double Top pattern has been formed on AUDCAD M30. It signals that the trend has been changed from upwards to downwards. Probably, if the base of the pattern 0.9862 is broken, the downward movement will continue.
AUDCAD M5
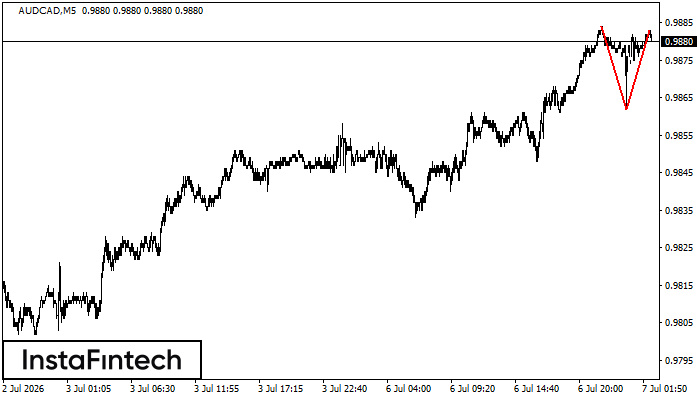
Double Top
On the chart of AUDCAD M5 the Double Top reversal pattern has been formed. Characteristics: the upper boundary 0.9883; the lower boundary 0.9862; the width of the pattern 21 points. The signal: a break of the lower boundary will cause continuation of the downward trend targeting the 0.9847 level.
AUDCAD M30
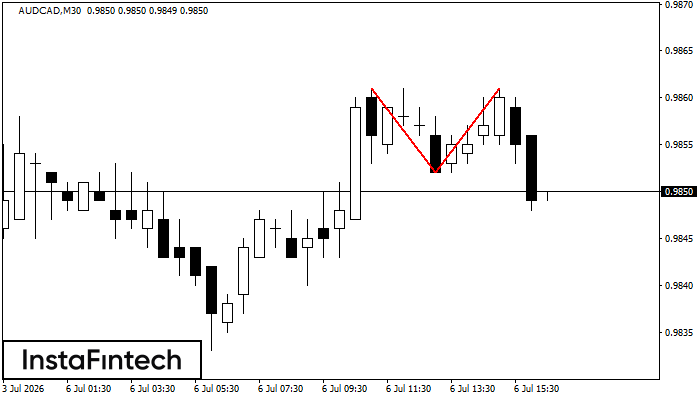
Double Top
On the chart of AUDCAD M30 the Double Top reversal pattern has been formed. Characteristics: the upper boundary 0.9861; the lower boundary 0.9852; the width of the pattern 9 points. The signal: a break of the lower boundary will cause continuation of the downward trend targeting the 0.9822 level.
AUDCAD M15
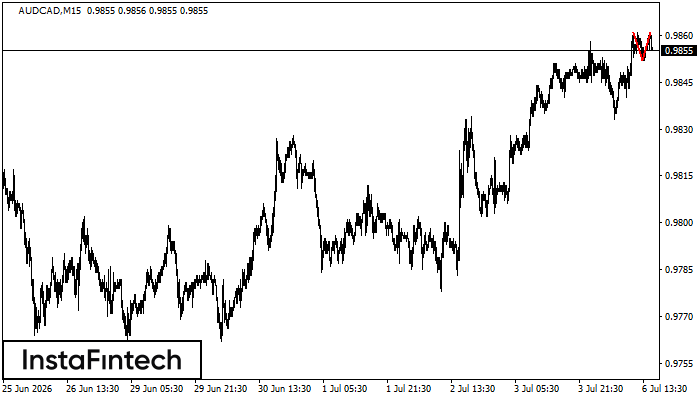
Double Top
The Double Top reversal pattern has been formed on AUDCAD M15. Characteristics: the upper boundary 0.9861; the lower boundary 0.9852; the width of the pattern is 9 points. Sell trades are better to be opened below the lower boundary 0.9852 with a possible movements towards the 0.9829 level.
AUDCAD M5
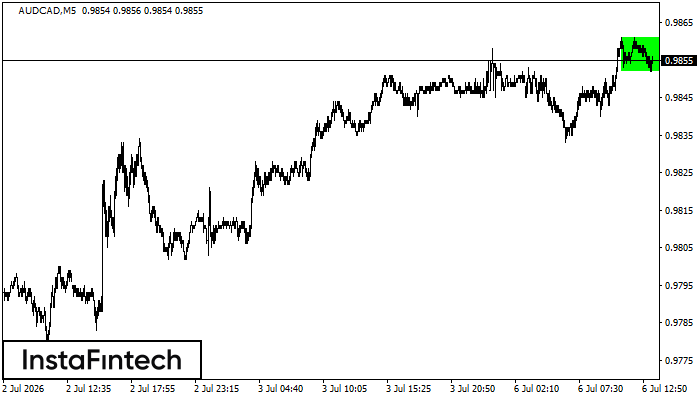
Bullish Rectangle
According to the chart of M5, AUDCAD formed the Bullish Rectangle which is a pattern of a trend continuation. The pattern is contained within the following borders: the lower border 0.9852 – 0.9852 and upper border 0.9861 – 0.9861. In case the upper border is broken, the instrument is likely to follow the upward trend.
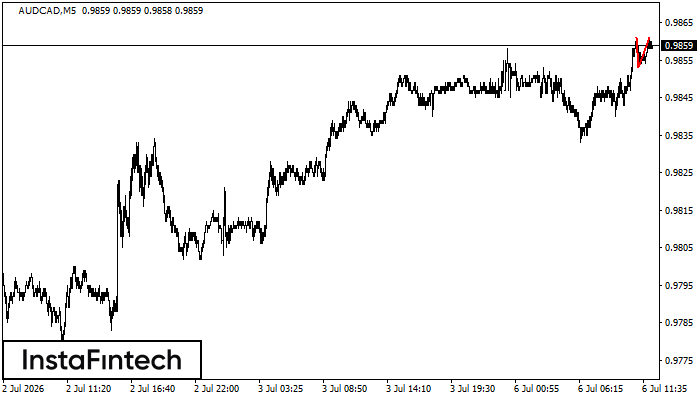
AUDCAD M5
Double Top
On the chart of AUDCAD M5 the Double Top reversal pattern has been formed. Characteristics: the upper boundary 0.9861; the lower boundary 0.9853; the width of the pattern 8 points. The signal: a break of the lower boundary will cause continuation of the downward trend targeting the 0.9838 level.
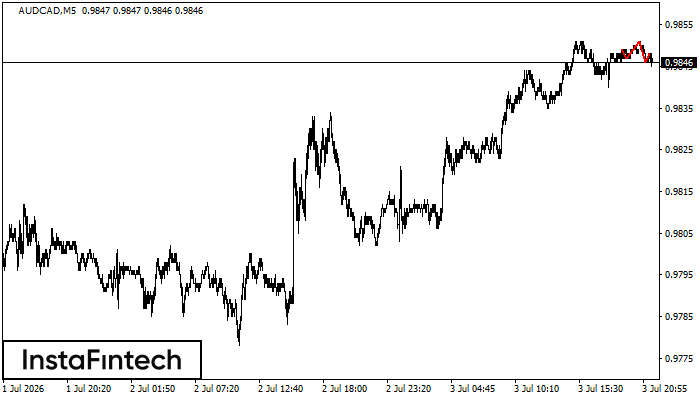
AUDCAD M5
Head and Shoulders
The AUDCAD M5 formed the Head and Shoulders pattern with the following features: The Head’s top is at 0.9851, the Neckline and the upward angle are at 0.9847/0.9846. The formation of this pattern can bring about changes in the current trend from bullish to bearish. In case the pattern triggers the expected changes, the price of AUDCAD will go towards 0.9831.