 Română
  Русский
 English
 Bahasa Indonesia
 Bahasa Malay
 ไทย
ไทย Español
 Deutsch
 Български
 Français
 Tiếng Việt
 中文
中文 বাংলা
বাংলা हिन्दी
 Čeština
 Українська
FX.co ★ Patterns AUDCHF | Australian Dollar (AUD) to Swiss Franc (CHF) Rate in the Forex market

AUDCHF H1
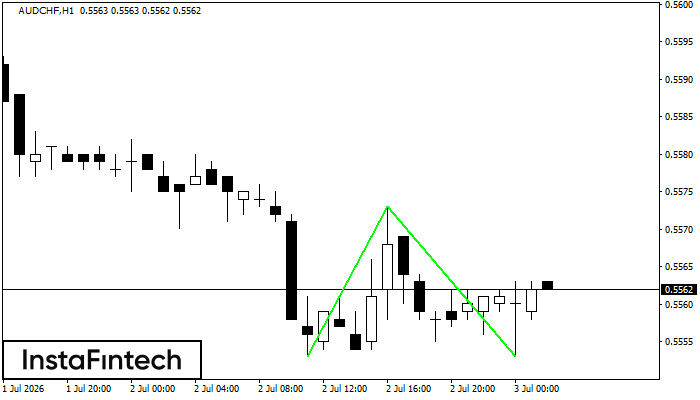
Double Bottom
The Double Bottom pattern has been formed on AUDCHF H1. Characteristics: the support level 0.5553; the resistance level 0.5573; the width of the pattern 20 points. If the resistance level is broken, a change in the trend can be predicted with the first target point lying at the distance of 20 points.
AUDCHF M5
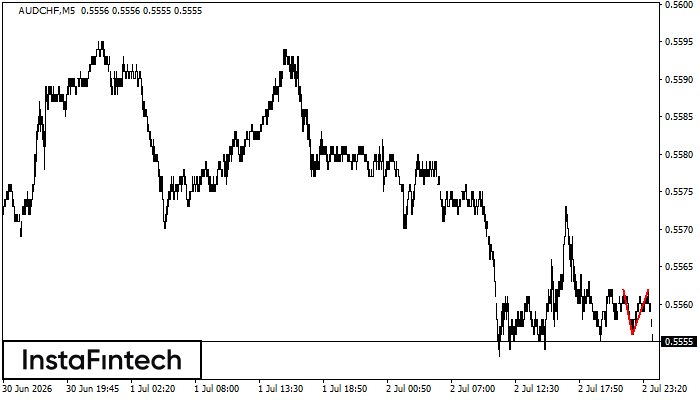
Double Top
On the chart of AUDCHF M5 the Double Top reversal pattern has been formed. Characteristics: the upper boundary 0.5562; the lower boundary 0.5556; the width of the pattern 6 points. The signal: a break of the lower boundary will cause continuation of the downward trend targeting the 0.5541 level.
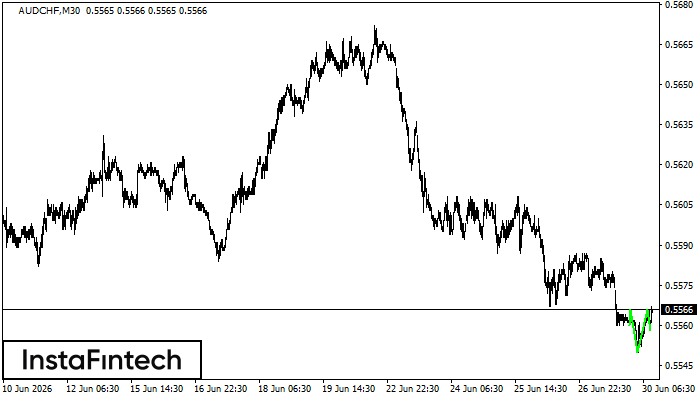
AUDCHF M30
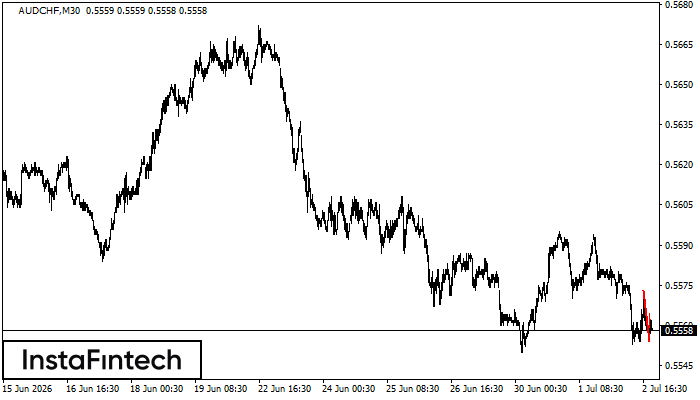
Bearish pennant
The Bearish pennant pattern has formed on the AUDCHF M30 chart. This pattern type is characterized by a slight slowdown after which the price will move in the direction of the original trend. In case the price fixes below the pattern’s low of 0.5554, a trader will be able to successfully enter the sell position.
AUDCHF M5
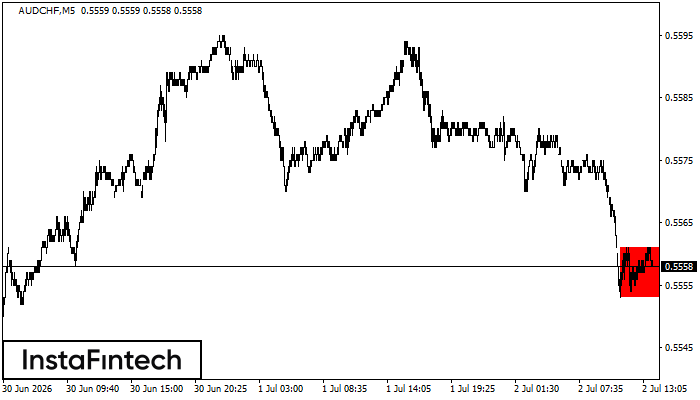
Bearish Rectangle
According to the chart of M5, AUDCHF formed the Bearish Rectangle. This type of a pattern indicates a trend continuation. It consists of two levels: resistance 0.5561 - 0.0000 and support 0.5553 – 0.5553. In case the resistance level 0.5553 - 0.5553 is broken, the instrument is likely to follow the bearish trend.
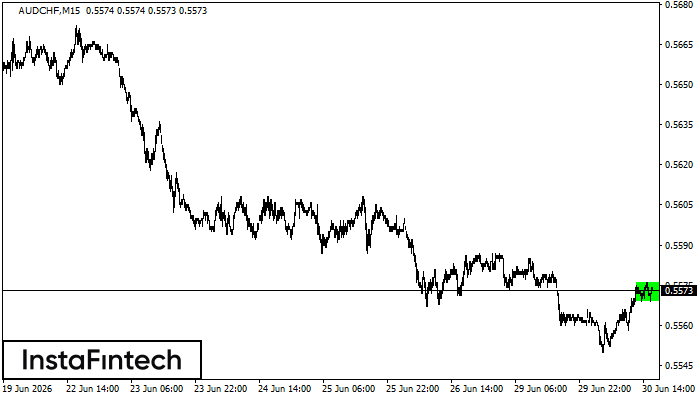
AUDCHF M15
Bullish Rectangle
According to the chart of M15, AUDCHF formed the Bullish Rectangle. The pattern indicates a trend continuation. The upper border is 0.5576, the lower border is 0.5569. The signal means that a long position should be opened above the upper border 0.5576 of the Bullish Rectangle.
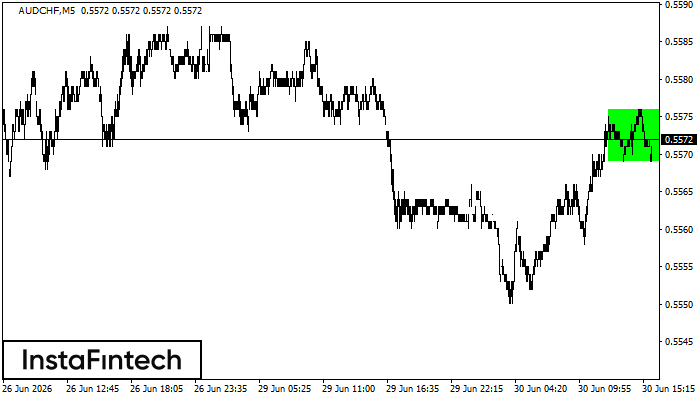
AUDCHF M5
Bullish Rectangle
According to the chart of M5, AUDCHF formed the Bullish Rectangle. The pattern indicates a trend continuation. The upper border is 0.5576, the lower border is 0.5569. The signal means that a long position should be opened above the upper border 0.5576 of the Bullish Rectangle.
AUDCHF M30
Inverse Head and Shoulder
According to the chart of M30, AUDCHF formed the Inverse Head and Shoulder pattern. The Head’s top is set at 0.5566 while the median line of the Neck is found at 0.5550/0.5558. The formation of the Inverse Head and Shoulder pattern evidently signals a reversal of the downward trend. In other words, in case the scenario comes true, the price of AUDCHF will go towards 0.5596
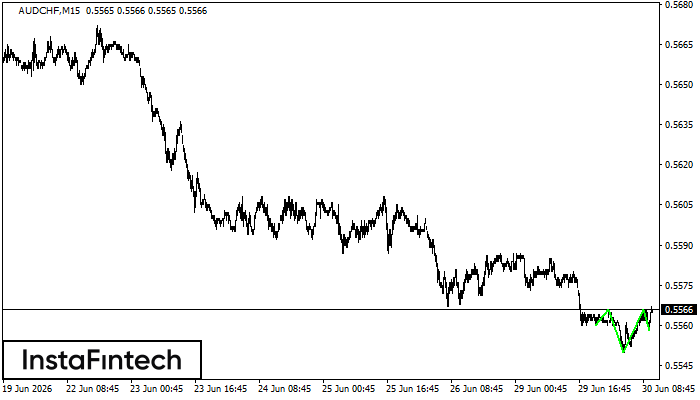
AUDCHF M15
Inverse Head and Shoulder
According to the chart of M15, AUDCHF produced the pattern termed the Inverse Head and Shoulder. The Head is fixed at 0.5550 while the median line of the Neck is set at 0.5566/0.5566. The formation of the Inverse Head and Shoulder Pattern clearly indicates a reversal of the downward trend. In means that in case the scenario comes true, the price of AUDCHF will go towards 0.5588.
AUDCHF M30
Inverse Head and Shoulder
According to the chart of M30, AUDCHF formed the Inverse Head and Shoulder pattern. The Head’s top is set at 0.5566 while the median line of the Neck is found at 0.5550/0.5558. The formation of the Inverse Head and Shoulder pattern evidently signals a reversal of the downward trend. In other words, in case the scenario comes true, the price of AUDCHF will go towards 0.5596
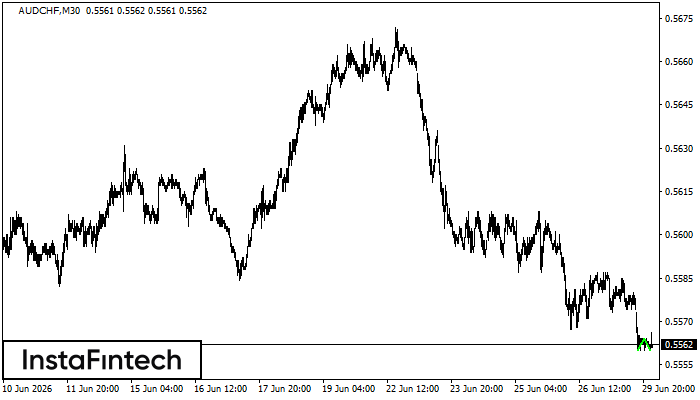
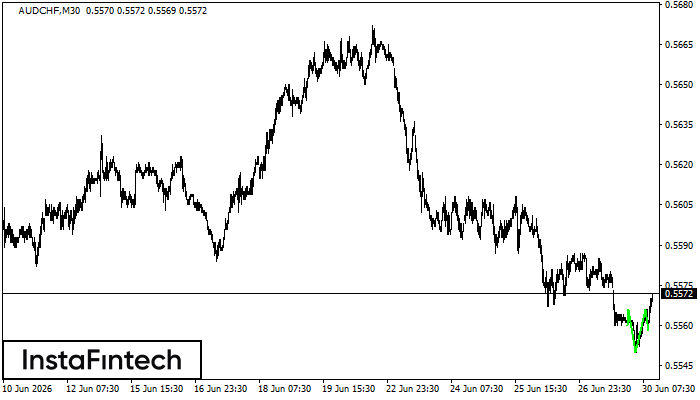
AUDCHF M30
Double Bottom
The Double Bottom pattern has been formed on AUDCHF M30. This formation signals a reversal of the trend from downwards to upwards. The signal is that a buy trade should be opened after the upper boundary of the pattern 0.5564 is broken. The further movements will rely on the width of the current pattern 4 points.