 Română
  Русский
 English
 Bahasa Indonesia
 Bahasa Malay
 ไทย
ไทย Español
 Deutsch
 Български
 Français
 Tiếng Việt
 中文
中文 বাংলা
বাংলা हिन्दी
 Čeština
 Українська
FX.co ★ Patterns AUDUSD | Australian Dollar (AUD) to US Dollar (USD) Rate in the Forex market

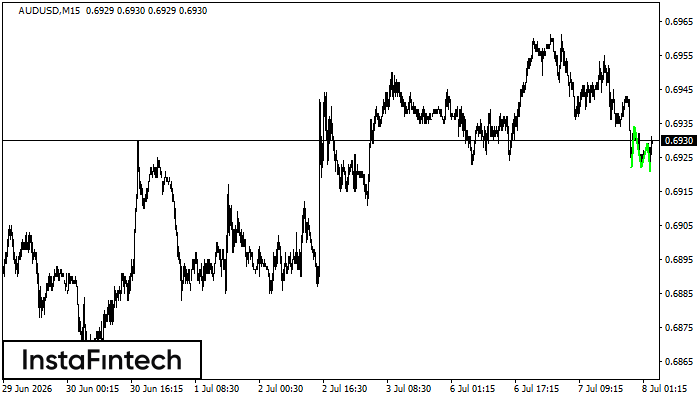
AUDUSD M15
Triple Bottom
The Triple Bottom pattern has formed on the chart of the AUDUSD M15 trading instrument. The pattern signals a change in the trend from downwards to upwards in the case of breakdown of 0.6934/0.6929.
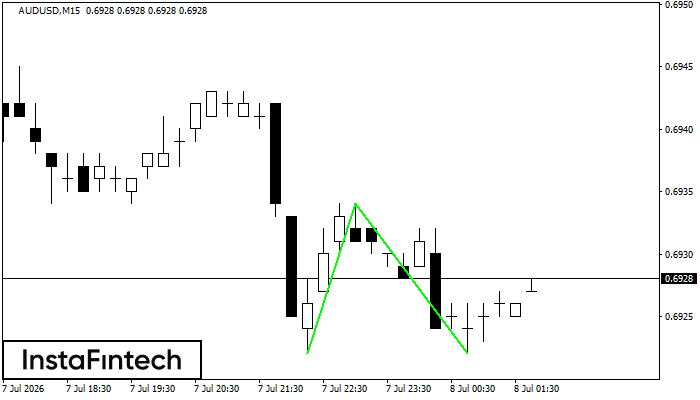
AUDUSD M15
Double Bottom
The Double Bottom pattern has been formed on AUDUSD M15. This formation signals a reversal of the trend from downwards to upwards. The signal is that a buy trade should be opened after the upper boundary of the pattern 0.6934 is broken. The further movements will rely on the width of the current pattern 12 points.
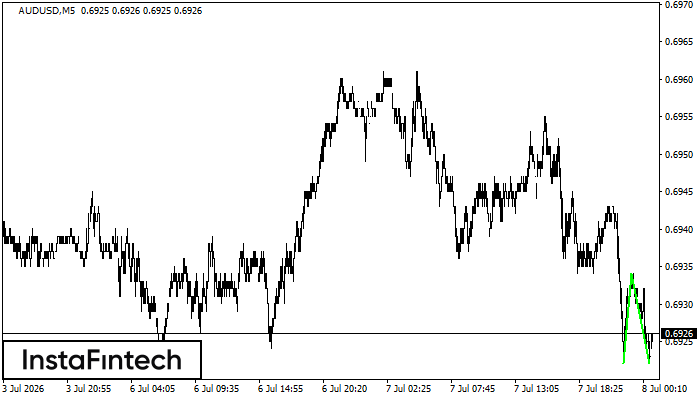
AUDUSD M5
Double Bottom
The Double Bottom pattern has been formed on AUDUSD M5. This formation signals a reversal of the trend from downwards to upwards. The signal is that a buy trade should be opened after the upper boundary of the pattern 0.6934 is broken. The further movements will rely on the width of the current pattern 12 points.
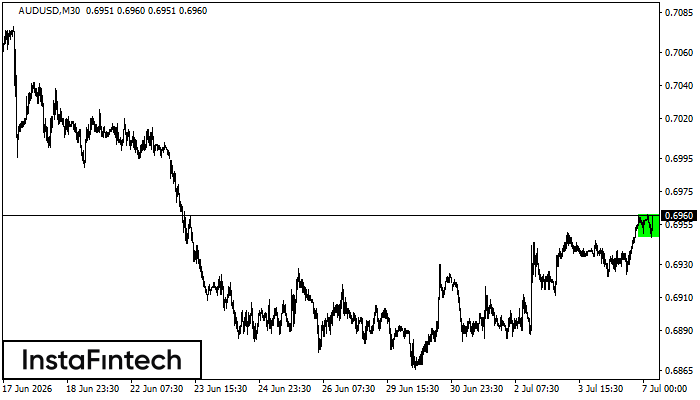
AUDUSD M30
Bullish Rectangle
According to the chart of M30, AUDUSD formed the Bullish Rectangle. This type of a pattern indicates a trend continuation. It consists of two levels: resistance 0.6961 and support 0.6947. In case the resistance level 0.6961 - 0.6961 is broken, the instrument is likely to follow the bullish trend.
AUDUSD M15
Bullish Rectangle
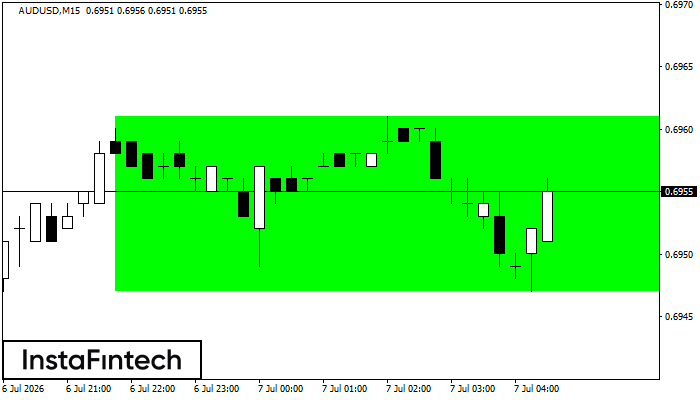
According to the chart of M15, AUDUSD formed the Bullish Rectangle. The pattern indicates a trend continuation. The upper border is 0.6961, the lower border is 0.6947. The signal means that a long position should be opened above the upper border 0.6961 of the Bullish Rectangle.
AUDUSD M5
Bullish Rectangle
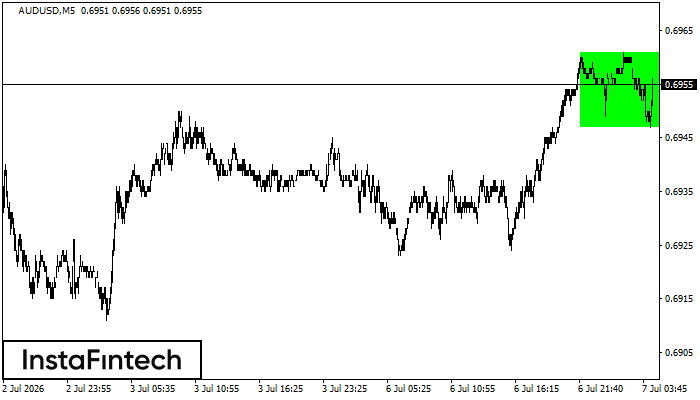
According to the chart of M5, AUDUSD formed the Bullish Rectangle. This type of a pattern indicates a trend continuation. It consists of two levels: resistance 0.6961 and support 0.6947. In case the resistance level 0.6961 - 0.6961 is broken, the instrument is likely to follow the bullish trend.
AUDUSD M5
Bullish Symmetrical Triangle
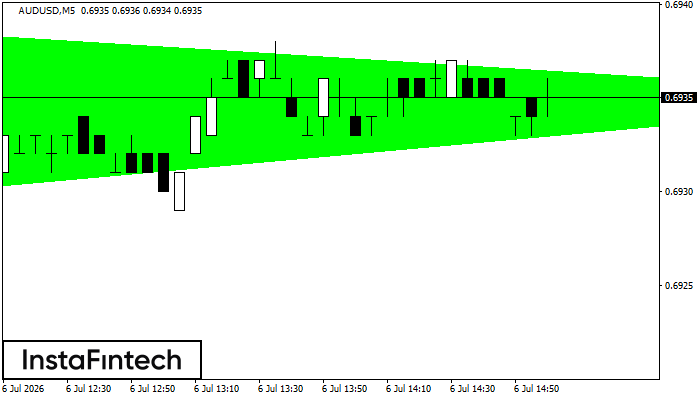
According to the chart of M5, AUDUSD formed the Bullish Symmetrical Triangle pattern, which signals the trend will continue. Description. The upper border of the pattern touches the coordinates 0.6939/0.6935 whereas the lower border goes across 0.6929/0.6935. The pattern width is measured on the chart at 10 pips. If the Bullish Symmetrical Triangle pattern is in progress during the upward trend, this indicates the current trend will go on. In case 0.6935 is broken, the price could continue its move toward 0.6950.
AUDUSD H1
Triple Top
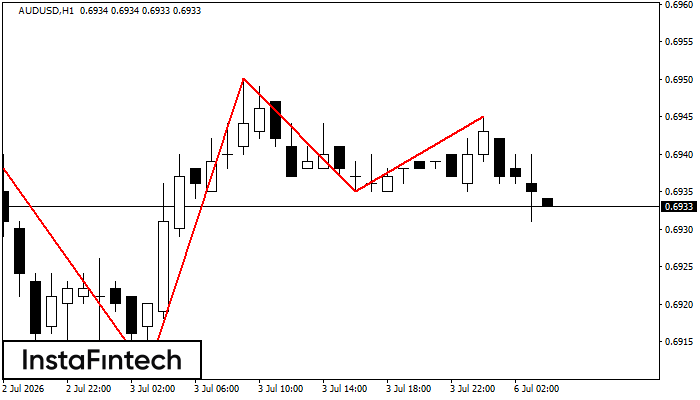
The Triple Top pattern has formed on the chart of the AUDUSD H1 trading instrument. It is a reversal pattern featuring the following characteristics: resistance level -1, support level -24, and pattern’s width 33. Forecast If the price breaks through the support level 0.6911, it is likely to move further down to 0.6910.
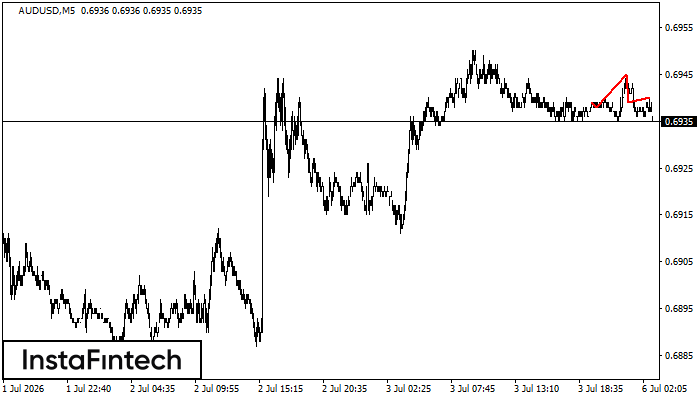
AUDUSD M5
Head and Shoulders
The technical pattern called Head and Shoulders has appeared on the chart of AUDUSD M5. There are weighty reasons to suggest that the price will surpass the Neckline 0.6938/0.6939 after the right shoulder has been formed. So, the trend is set to change with the price heading for 0.6924.
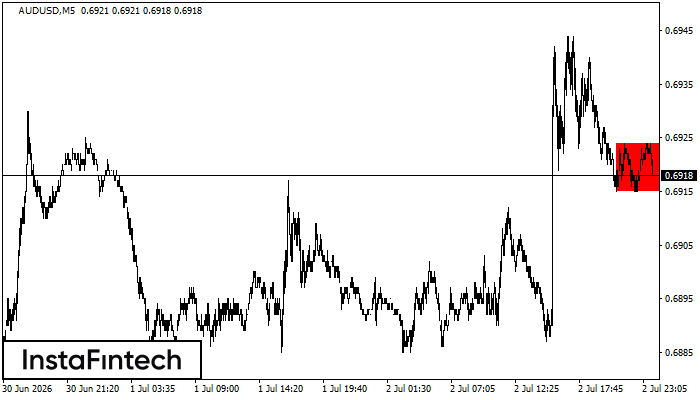
AUDUSD M5
Bearish Rectangle
According to the chart of M5, AUDUSD formed the Bearish Rectangle. This type of a pattern indicates a trend continuation. It consists of two levels: resistance 0.6924 - 0.0000 and support 0.6915 – 0.6915. In case the resistance level 0.6915 - 0.6915 is broken, the instrument is likely to follow the bearish trend.